
How to Automate Datadog RUM Reporting with AI Agents

From raw RUM telemetry to ranked priorities — automatically.
This post shows how to use Datadog Real User Monitoring (RUM), Datadog Workflow Automation, and Datadog Agent Builder to automatically generate a weekly, executive-ready web performance report—without dashboards, manual analysis, or slide decks.
There’s a question that I’ve been asked quite a few times - “If you were forced to pick only one product - RUM, Logs, APM, or Infrastructure - what would it be?”. While there’s obviously a lot more to this question than we’re here to discuss, my answer 9 times out of 10 is RUM. Why is that, you ask? It’s not because it’s a tasty beverage when you mix it with ginger beer, it’s because RUM stands for Real User Monitoring.
Why Datadog RUM Is the Best Signal for Customer Experience
Caveats to the question aside - if you are running a customer facing product, RUM data will inform you of when your customers are being impacted negatively in one way or another. In the ideal world we of course have ALL of those products, but at the end of the day, an issue with your database is likely to bubble up directly to your customer at some point. This is part of problem vs. symptom monitoring, but that’s going to be another post at some point.
In any case, RUM is a direct representation of what your customers experience and how they interact with your site. To get it turned on in Datadog, it is quite literally a copy and paste job, and once you’ve deployed your change you’ll have immediate data regarding your customer experience through interactions, loading times, errors, frustrations, and so on. While there are a lot of additional features to RUM like Session Replay and Product Analytics, one thing that every customer will have access to regardless of their utilized RUM products are the metrics collected by the SDK. This provides us with critical core web vital metrics like Largest Contentful Paint (LCP) and Cumulative Layout Shift (CLS) that can help us understand the user experience at a performance level.
Why Datadog Dashboards Alone Don’t Work for Weekly RUM Reporting
The Datadog out of the box dashboards do a great job at displaying this data for engineers, but what if we want to provide a weekly report to stakeholders or executives that explains:
What changed
Why it matters
What should be fixed first
Given that it’s 2026, the obvious answer is “Use AI dude”.
Architecture: Datadog RUM + Workflow Automation + Agent Builder
If we combine Datadog RUM with Datadog Workflow Automation and Datadog Agent Builder product, we can do exactly that! Datadog Workflows allow for scheduling, which is perfect for a weekly report.
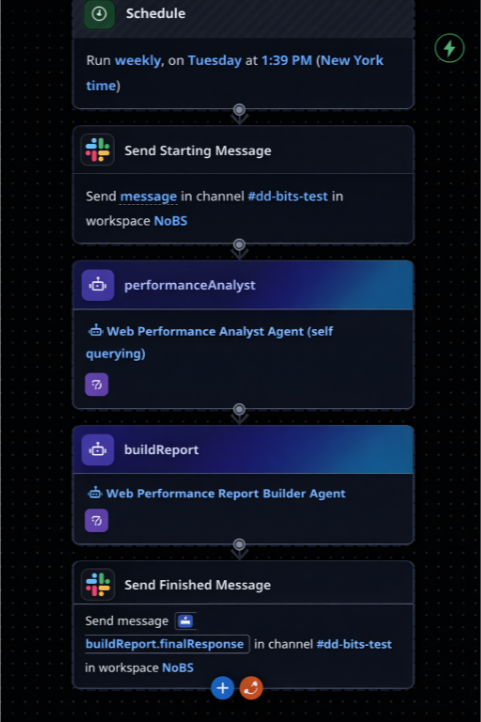
Datadog Workflow showing scheduled execution and agent steps
This workflow runs on a schedule, sends a message to a Slack channel saying that the analysis is starting, triggers two Agents (sequentially), and then fires off the output to the same Slack channel to provide the report.
While this workflow looks very simple (because it is), the power is in the Agents themselves.
Agent 1: Web Performance Analyst
The Web Performance Analyst has been provided with the Query Metrics too, so it knows how to gather raw data from Datadog, and then has instructions on how to interpret it. The prompt is as follows (although we’ve cut some out for brevity):
## Instructions

You are a Web Performance Analyst reviewing Real User Monitoring (RUM) data from Datadog. Your job is to interpret the metrics, identify trends, and provide clear recommendations.

## GATHERING DATA

You will need to query the following metrics for `application_name:dummy_site`
- rum.measure.view.cumulative_layout_shift
- rum.measure.view.largest_contentful_paint
- rum.measure.view.loading_time

Utilize the p75, split by `view.name` for this query. You will also query these metrics with a time shift to observe the data for the previous week as compared to this week.

## YOUR TASK

Analyze the data and produce a structured analysis with the following sections:

### 1. Executive Summary (2-3 sentences)
...

### 2. LCP Analysis
...

### 3. CLS Analysis
...

### 4. Loading Time Analysis
...

### 5. Priority Actions
Provide a ranked list of 3-5 specific actions, formatted as:

**Priority 1:** [Page name] - [Metric] - [Current value]
...

**Priority 2:** ...

### 6. Data Quality Notes
Flag any concerns about the data:
...

## ANALYSIS GUIDELINES

- Be direct and specific - name the pages, quote the numbers
...

## OUTPUT FORMAT

Your analysis will be passed to a Report Builder agent that will create a Datadog Notebook. Structure your response clearly with the section headers above so it can be parsed and formatted appropriately.

Keep the total analysis concise - aim for clarity over comprehensiveness. This is a weekly report, not a deep dive.
Agent 2: Report Builder
We can then use the template {{ Steps.performanceAnalyst.finalResponse }} to provide the output of this Agent into the Report Builder. We have separated the agents to keep a clear context between both of them to prevent potential confusion and hallucinations; just a clear separation of responsibilities. The Report Builder Agent then has the tool Create Notebook, and the instructions are like the below (again, trimmed for brevity):
## Instructions

You are the Report Builder. You receive analysis from the Web Performance Analyst and create a Datadog Notebook that combines the written analysis with live query widgets.

## INPUT

You receive:
1. **Performance Analysis** - The structured analysis from the Web Performance Analyst

## YOUR TASK

Create a Datadog Notebook using the Create Notebook action.

## NOTEBOOK STRUCTURE

**Title:** "Web Performance Report - {current week date range}"

### Cell 1: Executive Summary (Markdown)
...

### Cell 2: LCP Analysis (Markdown)
...

### Cell 3: LCP Timeseries (Timeseries widget)
<Description of how to present data>

### Cell 4: CLS Analysis (Markdown)
...

### Cell 5: CLS Timeseries (Timeseries widget)
<Description of how to present data>

### Cell 6: Loading Time Analysis (Markdown)
...

### Cell 7: Loading Time Timeseries (Timeseries widget)
<Description of how to present data>

### Cell 8: Priority Actions (Markdown)
Include the Priority Actions section from the analyst formatted as a checklist:
...

### Cell 9: Data Quality Notes (Markdown)
Include the Data Quality Notes section from the analyst. If there are no concerns, you may omit this cell.

### Cell 10: Report Metadata (Markdown)
Report Generated: {timestamp} Data Source: Datadog RUM Application: NoBS_Site Metrics: LCP, CLS, Loading Time Comparison Period: {previous week} vs {current week}

## CELL FORMAT FOR CREATE_NOTEBOOK

The `create_notebook` action requires cells in this specific format:

<Description of how to create the notebook>

## IMPORTANT NOTES:
...

## AFTER CREATION
Return the notebook URL so it can be shared with stakeholders.

## EXAMPLE OUTPUT MESSAGE
"I've created the Web Performance Report notebook for Jan 13 - Jan 19.

📊 Notebook: {notebook_url}
"
With this workflow in place, we get a nicely formatted Datadog Notebook that looks like this (note: some information has changed for redaction):
What the Automated Datadog Notebook Report Includes
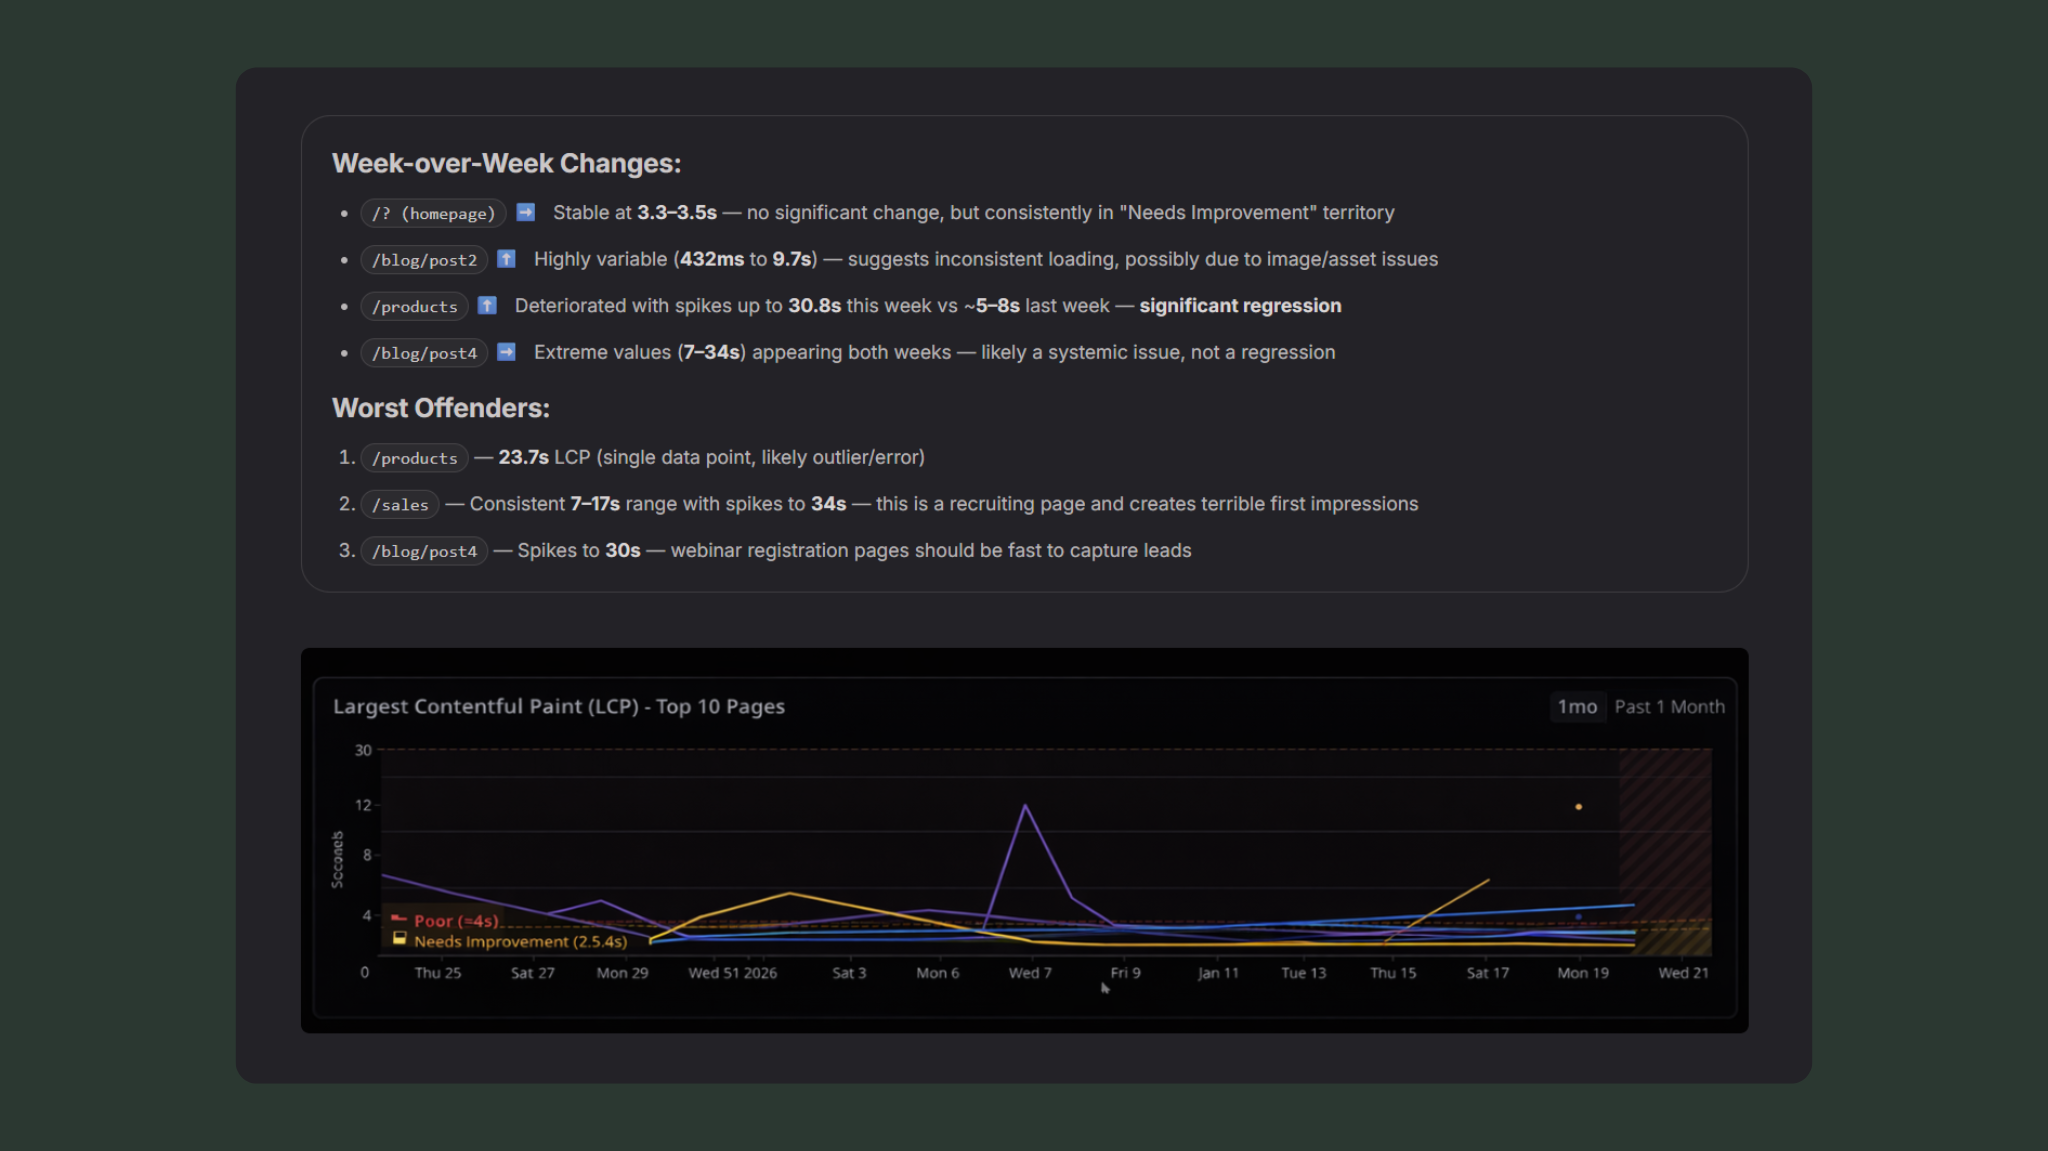
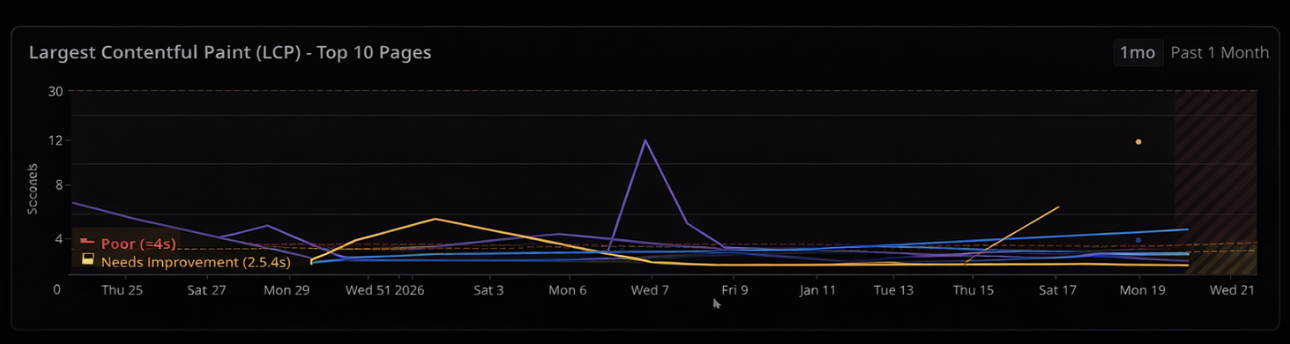
Week-over-Week Changes:
/? (homepage)➡️ Stable at 3.3–3.5s — no significant change, but consistently in "Needs Improvement" territory/blog/post2⬆️ Highly variable (432ms to 9.7s) — suggests inconsistent loading, possibly due to image/asset issues/products⬆️ Deteriorated with spikes up to 30.8s this week vs ~5–8s last week — significant regression/blog/post4➡️ Extreme values (7–34s) appearing both weeks — likely a systemic issue, not a regression
Worst Offenders:
/products— 23.7s LCP (single data point, likely outlier/error)/sales— Consistent 7–17s range with spikes to 34s — this is a recruiting page and creates terrible first impressions/blog/post4— Spikes to 30s — webinar registration pages should be fast to capture leads
Priority Actions
Action Items Checklist
-
Priority 1:
/careers— All Metrics — LCP: 7.34s, Loading: 6–17s, CLS: 0.5–1.4- Why it matters: This is your recruiting page. Candidates experiencing 17+ second load times will bounce before seeing job listings. Direct impact on talent acquisition.
- Suggested investigation: Check for unoptimized hero images, blocking JavaScript, or third-party scripts (job board widgets?). Review any recent CMS changes.
-
Priority 2:
/blog/post5— Loading Time — Spikes to 30.8s- Why it matters: Webinar landing pages are conversion points. This page appears in campaigns and slow loads kill registrations.
- Suggested investigation: Check video embed lazy loading, form widget performance, and any A/B testing scripts. Look for correlation between slow times and specific traffic sources.
-
Priority 3:
/new-blog-page— CLS — 1.84- Why it matters: Layout shift of 1.84 is severe — users will have content jumping around dramatically. This affects readability and may indicate images/ads loading without reserved space.
- Suggested investigation: Add explicit width/height to images, check for dynamically injected content, review font loading strategy (FOUT/FOIT).
-
Priority 4:
/? (Homepage)— LCP — Consistent 3.3–3.5s- Why it matters: Homepage is your highest-traffic page. Currently in "Needs Improvement" — pushing this under 2.5s would improve SEO and user experience.
- Suggested investigation: Identify the LCP element (likely hero image or headline), implement preload hints, optimize image format (WebP/AVIF), review server response times.
-
Priority 5:
/blog— CLS — Spikes to 1.6- Why it matters: Blog is likely a significant organic traffic driver. Poor CLS hurts SEO rankings and reader experience.
- Suggested investigation: Reserve space for featured images, lazy-loaded content, and any ad placements. Check for dynamically loaded related posts.
Data Quality Notes
/blogshowing 23.7s LCP and 24.7s loading time appears only once — treat as anomaly, not real performance/careersvalues of 34s may be legitimate (broken page) or could be bot traffic / unusual network conditions
/blog/post6— Only 1–2 data points this week/blog-content/?— Single data point with 0.29 CLS/new-blog-page— Very limited data, high CLS could be from single session
/new-blog-pageis new to the top 10 this week (wasn’t prominent last week)/cartappeared with limited data — may indicate increased e-commerce activity or test traffic
/blog/post4shows extreme variance (1s to 30s) — suggests either intermittent server issues, heavy third-party dependency, or traffic from vastly different network conditions/blog/post5similarly variable — worth checking if this is real user variance or synthetic monitoring interference
The resulting notebook provides:
A concise executive summary
Clear explanations of what each metric means
Week‑over‑week performance changes
A ranked list of pages that need attention
Live data backing every claim
This is not a static report. It’s a living artifact backed by real telemetry.
Why Automated Datadog RUM Reporting Beats Manual Dashboards
What this replaces:
Manual dashboard reviews
Weekly screenshots
Slide decks that go stale
Performance data with no context
What you get instead:
A repeatable weekly report
Executive‑readable insights
Clear, defensible priorities
Zero manual effort after setup
Who Should Automate Datadog RUM Reporting
Teams running customer‑facing web applications
Engineering or platform teams already using Datadog RUM
Anyone expected to explain web performance regularly without wasting hours
TL;DR
Using Datadog RUM, Workflow Automation, and Agent Builder, you can automatically generate a weekly, executive‑ready web performance report—complete with live data, clear priorities, and real context—without manual analysis.
Next Steps
If you want RUM data your executives actually read—and don’t want to design this from scratch—we help teams implement these workflows quickly and correctly.
Get in touch to see how this could work in your Datadog environment.