
Building Smarter Datadog Dashboards with AI

A Practical Guide to the MCP Server
Why Most Datadog Dashboards Fail (Even When the Data Is Right)
Datadog dashboards don’t fail because teams lack metrics. They fail because dashboard design gets squeezed between roadmap work, incident response, and legacy patterns that no longer fit how Datadog works. The result is dashboards that technically function but rarely get used. The Datadog MCP Server changes this by shifting the hard work earlier in the process — metric discovery, context, validation — so dashboards are designed intentionally before anyone touches JSON. In this post, we’ll show how we’re using MCP with AI assistants to build smarter Datadog dashboards faster, using a real cloud cost management example from our own environment.
What the Datadog MCP Server Actually Does (and Why That Matters)
MCP (Model Context Protocol) is a protocol that allows AI assistants to connect directly to external tools and data sources.
In Datadog’s case, the MCP server acts as a bridge, allowing an AI agent to:
Search metrics available in your Datadog environment
Inspect existing dashboards to understand current patterns
Query Datadog documentation for schema, syntax, and validation
All within a single chat session.
Why this matters:
In practice, MCP gives an AI assistant visibility into the same places an experienced engineer would look before building a dashboard — available metrics, existing patterns, and official documentation — without requiring hours of manual exploration.
The Real Shift: From “How Do I Build This?” to “Is This Worth Building?”
Rather than asking an AI to “generate a dashboard,” we use a structured prompt that forces the agent to slow down and behave like an experienced Datadog engineer. It must explore what metrics exist, understand their context, validate against official documentation, and present a clear dashboard plan for human approval before any JSON is written.
This flips the workflow from:
“Here’s a dashboard — hope it works” —> “Here’s a plan — should this dashboard exist at all?”
The Prompt Template We Use
Below is the prompt template we’ve developed while exploring the Datadog MCP Server. It consistently produces higher-quality dashboards because it enforces sequencing, validation, and human checkpoints.
Datadog Dashboard Generation Prompt Template
I need to create a Datadog dashboard for monitoring [DOMAIN/SYSTEM]. Before generating the dashboard JSON, please:
- Discover relevant metrics: Search for metrics related to
[KEY TERMS]to understand what's available in my environment - Understand metric context: For the most promising metrics, get their metadata (units, available tags, dimensions) so the dashboard can use appropriate aggregations and groupings
- Check existing dashboards: Search for any existing dashboards related to
[DOMAIN/SYSTEM]to understand current patterns and avoid duplication - Identify tagging policies: Search for any organization tagging strategies, policies, or conventions (e.g., required tags like team, env, service) by examining existing dashboards, monitors, or documentation. Apply discovered tagging conventions to the dashboard.
- Validate JSON structure: Use the Datadog MCP server documentation tool (
search_datadog_docs) to look up the current dashboard API schema and widget definition requirements. - Present dashboard plan for approval: Before generating JSON, provide a brief plan showing:
- Dashboard title and template variables
- Widget groups with planned widgets (name and type) for each
- STOP and wait for user confirmation before proceeding to JSON generation.
Based on your findings and the approved plan, generate a complete Datadog dashboard JSON configuration that includes:
- A descriptive title and description
- Logical widget groupings with group headers
- A mix of visualization types appropriate to the data (timeseries, toplist, query value, etc.)
- Appropriate time windows and aggregations for each metric
- Template variables for common filter dimensions (e.g., cluster, namespace, service)
- Meaningful widget titles that explain what each visualization shows
Why this works:
It prevents hallucinated metrics, forces schema validation, and ensures a human approves the dashboard before time is wasted generating JSON.
Applying the Template: Cloud Cost & Usage Dashboard
To make this concrete, we applied the template to generate a cloud cost and usage dashboard across AWS (with Azure and GCP checks included).
Before any JSON was created, the AI agent:
Confirmed Cloud Cost Management was enabled
Identified available cost metrics and dimensions
Flagged missing cost allocation tags
Checked for existing dashboards to avoid duplication
This context gathering normally requires tribal knowledge or manual exploration — MCP allows the AI to do it directly.
Dashboard Planning Before JSON (The Critical Step)
Once discovery was complete, the AI produced a dashboard plan for approval, including:
Dashboard title and description
Widget groups and visualization types
Template variables for filtering
Known limitations (e.g., missing tags, provider coverage gaps)
Only after approval did it proceed to generate the JSON definition. At NoBS, that approval step is always owned by an engineer who understands both the environment and the business question the dashboard is meant to answer.
This step is non-negotiable. Skipping it is how teams end up with dashboards nobody trusts.
Generating the Dashboard JSON
After approval, the AI used the validated context to generate a complete JSON definition for a Cloud Cost Management dashboard.
The generated dashboard includes:
Cost overview KPIs (MTD spend, burn rate, projections)
Cost trends and comparisons
Service-level and regional breakdowns
Platform and external API costs
Deeper service-specific analysis (e.g., Lambda enhanced metrics)
Simply importing the JSON into Datadog produces a functional, immediately useful dashboard.
Screenshots of the Generated Dashboard
The screenshots below show a subset of the widgets included in the generated Cloud Cost Management dashboard, after importing the JSON directly into Datadog.

View Full Dashboard JSON (Advanced)
The JSON below is the complete dashboard definition generated after human approval, and can be imported directly into Datadog via the UI or API.
JSON
{
"title": "Cloud Cost Management - AWS Overview",
"description": "Comprehensive view of AWS cloud costs including daily spend, service breakdowns, regional distribution, and trend analysis. Monitor month-to-date costs, identify top spending services, and track cost trends over time.",
"layout_type": "ordered",
"reflow_type": "fixed",
"template_variables": [
{
"name": "provider",
"prefix": "providername",
"available_values": [],
"default": "*"
},
{
"name": "aws_account",
"prefix": "aws_account",
"available_values": [],
"default": "*"
},
{
"name": "region",
"prefix": "region",
"available_values": [],
"default": "*"
},
{
"name": "aws_product",
"prefix": "aws_product",
"available_values": [],
"default": "*"
}
],
"widgets": [
{
"definition": {
"title": "Cost Overview KPIs",
"background_color": "vivid_blue",
"show_title": true,
"type": "group",
"layout_type": "ordered",
"widgets": [
{
"definition": {
"title": "Total Cloud Spend (MTD)",
"title_size": "16",
"title_align": "left",
"type": "query_value",
"requests": [
{
"response_format": "scalar",
"queries": [
{
"data_source": "cloud_cost",
"name": "query1",
"query": "sum:all.cost{$provider,$aws_account,$region,$aws_product}.rollup(sum, monthly)",
"aggregator": "sum"
}
],
"formulas": [
{
"formula": "query1"
}
]
}
],
"autoscale": true,
"precision": 2,
"custom_unit": "$"
},
"layout": { "x": 0, "y": 0, "width": 2, "height": 2 }
},
{
"definition": {
"title": "Daily Burn Rate (7d avg)",
"title_size": "16",
"title_align": "left",
"type": "query_value",
"requests": [
{
"response_format": "scalar",
"queries": [
{
"data_source": "cloud_cost",
"name": "query1",
"query": "sum:all.cost{$provider,$aws_account,$region,$aws_product}.rollup(sum, daily)",
"aggregator": "avg"
}
],
"formulas": [
{
"formula": "query1"
}
]
}
],
"autoscale": true,
"precision": 2,
"custom_unit": "$",
"timeseries_background": {
"type": "area",
"yaxis": { "include_zero": true }
}
},
"layout": { "x": 2, "y": 0, "width": 2, "height": 2 }
},
{
"definition": {
"title": "Yesterday's Spend",
"title_size": "16",
"title_align": "left",
"type": "query_value",
"requests": [
{
"response_format": "scalar",
"queries": [
{
"data_source": "cloud_cost",
"name": "query1",
"query": "sum:all.cost{$provider,$aws_account,$region,$aws_product}.rollup(sum, daily)",
"aggregator": "last"
}
],
"formulas": [
{
"formula": "query1"
}
]
}
],
"autoscale": true,
"precision": 2,
"custom_unit": "$"
},
"layout": { "x": 4, "y": 0, "width": 2, "height": 2 }
},
{
"definition": {
"title": "Projected Monthly Cost",
"title_size": "16",
"title_align": "left",
"type": "query_value",
"requests": [
{
"response_format": "scalar",
"queries": [
{
"data_source": "cloud_cost",
"name": "daily_avg",
"query": "sum:all.cost{$provider,$aws_account,$region,$aws_product}.rollup(sum, daily)",
"aggregator": "avg"
}
],
"formulas": [
{
"formula": "daily_avg * 30"
}
]
}
],
"autoscale": true,
"precision": 2,
"custom_unit": "$"
},
"layout": { "x": 6, "y": 0, "width": 2, "height": 2 }
},
{
"definition": {
"title": "Month-over-Month Change",
"title_size": "16",
"title_align": "left",
"type": "query_value",
"requests": [
{
"response_format": "scalar",
"queries": [
{
"data_source": "cloud_cost",
"name": "current",
"query": "sum:all.cost{$provider,$aws_account,$region,$aws_product}.rollup(sum, monthly)",
"aggregator": "sum"
},
{
"data_source": "cloud_cost",
"name": "previous",
"query": "sum:all.cost{$provider,$aws_account,$region,$aws_product}.rollup(sum, monthly)",
"aggregator": "sum"
}
],
"formulas": [
{
"formula": "month_before(current)"
}
]
}
],
"autoscale": true,
"precision": 1,
"custom_unit": "$"
},
"layout": { "x": 8, "y": 0, "width": 2, "height": 2 }
},
{
"definition": {
"title": "AWS Accounts",
"title_size": "16",
"title_align": "left",
"type": "query_value",
"requests": [
{
"response_format": "scalar",
"queries": [
{
"data_source": "cloud_cost",
"name": "query1",
"query": "sum:all.cost{$provider,$aws_account,$region,$aws_product} by {aws_account}.rollup(sum, daily)",
"aggregator": "last"
}
],
"formulas": [
{
"formula": "count_not_null(query1)"
}
]
}
],
"autoscale": true,
"precision": 0
},
"layout": { "x": 10, "y": 0, "width": 2, "height": 2 }
}
]
},
"layout": { "x": 0, "y": 0, "width": 12, "height": 3 }
},
{
"definition": {
"title": "Cost Trends",
"background_color": "vivid_green",
"show_title": true,
"type": "group",
"layout_type": "ordered",
"widgets": [
{
"definition": {
"title": "Daily Cloud Spend (Last 30 Days)",
"title_size": "16",
"title_align": "left",
"show_legend": true,
"legend_layout": "auto",
"legend_columns": ["avg", "min", "max", "value", "sum"],
"type": "timeseries",
"requests": [
{
"response_format": "timeseries",
"queries": [
{
"data_source": "cloud_cost",
"name": "query1",
"query": "sum:all.cost{$provider,$aws_account,$region,$aws_product}.rollup(sum, daily)"
}
],
"formulas": [
{
"alias": "Daily Cost",
"formula": "query1"
}
],
"style": {
"palette": "dog_classic",
"line_type": "solid",
"line_width": "normal"
},
"display_type": "bars"
}
],
"yaxis": {
"include_zero": true,
"scale": "linear"
},
"markers": []
},
"layout": { "x": 0, "y": 0, "width": 8, "height": 3 }
},
{
"definition": {
"title": "Cost by Provider",
"title_size": "16",
"title_align": "left",
"show_legend": true,
"legend_layout": "auto",
"legend_columns": ["avg", "sum", "value"],
"type": "timeseries",
"requests": [
{
"response_format": "timeseries",
"queries": [
{
"data_source": "cloud_cost",
"name": "query1",
"query": "sum:all.cost{$aws_account,$region,$aws_product} by {providername}.rollup(sum, daily)"
}
],
"formulas": [
{
"formula": "query1"
}
],
"style": {
"palette": "dog_classic",
"line_type": "solid",
"line_width": "normal"
},
"display_type": "area"
}
],
"yaxis": {
"include_zero": true,
"scale": "linear"
}
},
"layout": { "x": 8, "y": 0, "width": 4, "height": 3 }
},
{
"definition": {
"title": "Week-over-Week Comparison",
"title_size": "16",
"title_align": "left",
"show_legend": true,
"legend_layout": "auto",
"legend_columns": ["avg", "sum", "value"],
"type": "timeseries",
"requests": [
{
"response_format": "timeseries",
"queries": [
{
"data_source": "cloud_cost",
"name": "current",
"query": "sum:all.cost{$provider,$aws_account,$region,$aws_product}.rollup(sum, daily)"
},
{
"data_source": "cloud_cost",
"name": "previous",
"query": "sum:all.cost{$provider,$aws_account,$region,$aws_product}.rollup(sum, daily)"
}
],
"formulas": [
{
"alias": "This Week",
"formula": "current"
},
{
"alias": "Last Week",
"formula": "week_before(current)"
}
],
"style": {
"palette": "dog_classic",
"line_type": "solid",
"line_width": "normal"
},
"display_type": "line"
}
],
"yaxis": {
"include_zero": true,
"scale": "linear"
}
},
"layout": { "x": 0, "y": 3, "width": 6, "height": 3 }
},
{
"definition": {
"title": "Cumulative Monthly Spend",
"title_size": "16",
"title_align": "left",
"show_legend": true,
"legend_layout": "auto",
"legend_columns": ["value"],
"type": "timeseries",
"requests": [
{
"response_format": "timeseries",
"queries": [
{
"data_source": "cloud_cost",
"name": "query1",
"query": "sum:all.cost{$provider,$aws_account,$region,$aws_product}.rollup(sum, daily)"
}
],
"formulas": [
{
"alias": "Cumulative Cost",
"formula": "cumsum(query1)"
}
],
"style": {
"palette": "warm",
"line_type": "solid",
"line_width": "thick"
},
"display_type": "line"
}
],
"yaxis": {
"include_zero": true,
"scale": "linear"
}
},
"layout": { "x": 6, "y": 3, "width": 6, "height": 3 }
}
]
},
"layout": { "x": 0, "y": 3, "width": 12, "height": 7 }
},
{
"definition": {
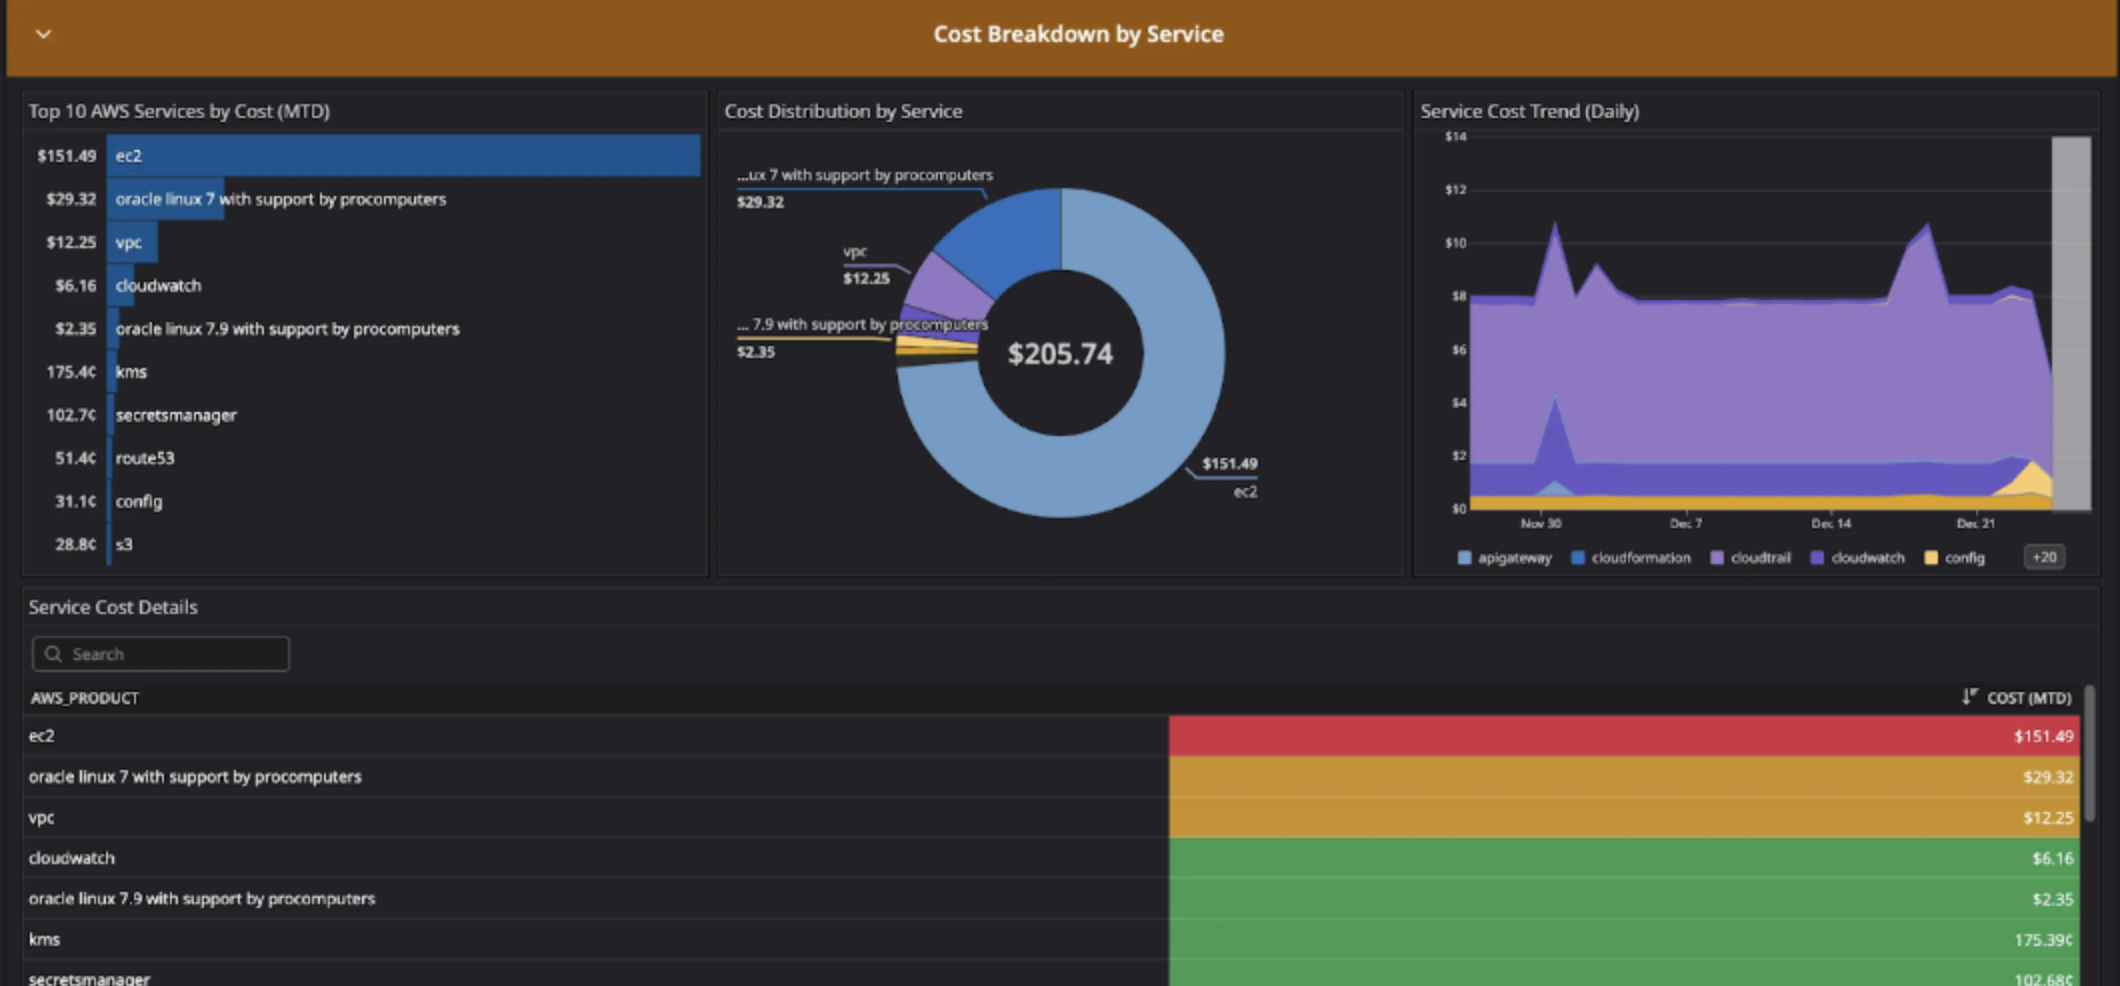
"title": "Cost Breakdown by Service",
"background_color": "vivid_orange",
"show_title": true,
"type": "group",
"layout_type": "ordered",
"widgets": [
{
"definition": {
"title": "Top 10 AWS Services by Cost (MTD)",
"title_size": "16",
"title_align": "left",
"type": "toplist",
"requests": [
{
"response_format": "scalar",
"queries": [
{
"data_source": "cloud_cost",
"name": "query1",
"query": "sum:aws.cost.net.amortized.shared.resources.allocated{$aws_account,$region,$aws_product} by {aws_product}.rollup(sum, monthly)",
"aggregator": "sum"
}
],
"formulas": [
{
"formula": "query1",
"limit": {
"count": 10,
"order": "desc"
}
}
]
}
],
"style": {
"display": {
"type": "stacked",
"legend": "automatic"
},
"palette": "datadog16"
}
},
"layout": { "x": 0, "y": 0, "width": 4, "height": 4 }
},
{
"definition": {
"title": "Cost Distribution by Service",
"title_size": "16",
"title_align": "left",
"type": "sunburst",
"requests": [
{
"response_format": "scalar",
"queries": [
{
"data_source": "cloud_cost",
"name": "query1",
"query": "sum:aws.cost.net.amortized.shared.resources.allocated{$aws_account,$region,$aws_product} by {aws_product}.rollup(sum, monthly)",
"aggregator": "sum"
}
],
"formulas": [
{
"formula": "query1"
}
]
}
],
"legend": {
"type": "automatic"
}
},
"layout": { "x": 4, "y": 0, "width": 4, "height": 4 }
},
{
"definition": {
"title": "Service Cost Trend (Daily)",
"title_size": "16",
"title_align": "left",
"show_legend": true,
"legend_layout": "auto",
"legend_columns": ["avg", "sum", "value"],
"type": "timeseries",
"requests": [
{
"response_format": "timeseries",
"queries": [
{
"data_source": "cloud_cost",
"name": "query1",
"query": "sum:aws.cost.net.amortized.shared.resources.allocated{$aws_account,$region,$aws_product} by {aws_product}.rollup(sum, daily)"
}
],
"formulas": [
{
"formula": "query1"
}
],
"style": {
"palette": "dog_classic",
"line_type": "solid",
"line_width": "normal"
},
"display_type": "area"
}
],
"yaxis": {
"include_zero": true,
"scale": "linear"
}
},
"layout": { "x": 8, "y": 0, "width": 4, "height": 4 }
},
{
"definition": {
"title": "Service Cost Details",
"title_size": "16",
"title_align": "left",
"type": "query_table",
"requests": [
{
"response_format": "scalar",
"queries": [
{
"data_source": "cloud_cost",
"name": "cost",
"query": "sum:aws.cost.net.amortized.shared.resources.allocated{$aws_account,$region,$aws_product} by {aws_product}.rollup(sum, monthly)",
"aggregator": "sum"
}
],
"formulas": [
{
"alias": "Cost (MTD)",
"formula": "cost",
"limit": {
"count": 25,
"order": "desc"
},
"conditional_formats": [
{
"comparator": ">",
"value": 100,
"palette": "white_on_red"
},
{
"comparator": ">",
"value": 10,
"palette": "white_on_yellow"
},
{
"comparator": "<=",
"value": 10,
"palette": "white_on_green"
}
]
}
]
}
],
"has_search_bar": "auto"
},
"layout": { "x": 0, "y": 4, "width": 12, "height": 4 }
}
]
},
"layout": { "x": 0, "y": 10, "width": 12, "height": 9 }
},
{
"definition": {
"title": "Regional & Account Analysis",
"background_color": "vivid_purple",
"show_title": true,
"type": "group",
"layout_type": "ordered",
"widgets": [
{
"definition": {
"title": "Cost by Region (MTD)",
"title_size": "16",
"title_align": "left",
"type": "toplist",
"requests": [
{
"response_format": "scalar",
"queries": [
{
"data_source": "cloud_cost",
"name": "query1",
"query": "sum:aws.cost.net.amortized.shared.resources.allocated{$provider,$aws_account,$aws_product} by {region}.rollup(sum, monthly)",
"aggregator": "sum"
}
],
"formulas": [
{
"formula": "query1",
"limit": {
"count": 10,
"order": "desc"
}
}
]
}
],
"style": {
"display": {
"type": "stacked",
"legend": "automatic"
},
"palette": "datadog16"
}
},
"layout": { "x": 0, "y": 0, "width": 4, "height": 3 }
},
{
"definition": {
"title": "Cost by AWS Account (MTD)",
"title_size": "16",
"title_align": "left",
"type": "toplist",
"requests": [
{
"response_format": "scalar",
"queries": [
{
"data_source": "cloud_cost",
"name": "query1",
"query": "sum:aws.cost.net.amortized.shared.resources.allocated{$provider,$region,$aws_product} by {aws_account}.rollup(sum, monthly)",
"aggregator": "sum"
}
],
"formulas": [
{
"formula": "query1",
"limit": {
"count": 10,
"order": "desc"
}
}
]
}
],
"style": {
"display": {
"type": "stacked",
"legend": "automatic"
},
"palette": "datadog16"
}
},
"layout": { "x": 4, "y": 0, "width": 4, "height": 3 }
},
{
"definition": {
"title": "Regional Cost Trend",
"title_size": "16",
"title_align": "left",
"show_legend": true,
"legend_layout": "auto",
"legend_columns": ["avg", "sum", "value"],
"type": "timeseries",
"requests": [
{
"response_format": "timeseries",
"queries": [
{
"data_source": "cloud_cost",
"name": "query1",
"query": "sum:aws.cost.net.amortized.shared.resources.allocated{$provider,$aws_account,$aws_product} by {region}.rollup(sum, daily)"
}
],
"formulas": [
{
"formula": "query1"
}
],
"style": {
"palette": "dog_classic",
"line_type": "solid",
"line_width": "normal"
},
"display_type": "area"
}
],
"yaxis": {
"include_zero": true,
"scale": "linear"
}
},
"layout": { "x": 8, "y": 0, "width": 4, "height": 3 }
}
]
},
"layout": { "x": 0, "y": 19, "width": 12, "height": 4 }
},
{
"definition": {
"title": "Service Deep Dive - Major Cost Categories",
"background_color": "vivid_yellow",
"show_title": true,
"type": "group",
"layout_type": "ordered",
"widgets": [
{
"definition": {
"title": "EC2 Daily Cost",
"title_size": "16",
"title_align": "left",
"type": "query_value",
"requests": [
{
"response_format": "scalar",
"queries": [
{
"data_source": "cloud_cost",
"name": "query1",
"query": "sum:aws.cost.net.amortized.shared.resources.allocated{aws_product:ec2,$aws_account,$region}.rollup(sum, daily)",
"aggregator": "last"
}
],
"formulas": [
{
"formula": "query1"
}
],
"conditional_formats": [
{
"comparator": ">",
"value": 100,
"palette": "white_on_red"
},
{
"comparator": ">",
"value": 10,
"palette": "white_on_yellow"
},
{
"comparator": "<=",
"value": 10,
"palette": "white_on_green"
}
]
}
],
"autoscale": true,
"precision": 2,
"custom_unit": "$",
"timeseries_background": {
"type": "area",
"yaxis": { "include_zero": true }
}
},
"layout": { "x": 0, "y": 0, "width": 2, "height": 2 }
},
{
"definition": {
"title": "VPC Daily Cost",
"title_size": "16",
"title_align": "left",
"type": "query_value",
"requests": [
{
"response_format": "scalar",
"queries": [
{
"data_source": "cloud_cost",
"name": "query1",
"query": "sum:aws.cost.net.amortized.shared.resources.allocated{aws_product:vpc,$aws_account,$region}.rollup(sum, daily)",
"aggregator": "last"
}
],
"formulas": [
{
"formula": "query1"
}
]
}
],
"autoscale": true,
"precision": 2,
"custom_unit": "$",
"timeseries_background": {
"type": "area",
"yaxis": { "include_zero": true }
}
},
"layout": { "x": 2, "y": 0, "width": 2, "height": 2 }
},
{
"definition": {
"title": "CloudWatch Daily Cost",
"title_size": "16",
"title_align": "left",
"type": "query_value",
"requests": [
{
"response_format": "scalar",
"queries": [
{
"data_source": "cloud_cost",
"name": "query1",
"query": "sum:aws.cost.net.amortized.shared.resources.allocated{aws_product:cloudwatch,$aws_account,$region}.rollup(sum, daily)",
"aggregator": "last"
}
],
"formulas": [
{
"formula": "query1"
}
]
}
],
"autoscale": true,
"precision": 2,
"custom_unit": "$",
"timeseries_background": {
"type": "area",
"yaxis": { "include_zero": true }
}
},
"layout": { "x": 4, "y": 0, "width": 2, "height": 2 }
},
{
"definition": {
"title": "S3 Daily Cost",
"title_size": "16",
"title_align": "left",
"type": "query_value",
"requests": [
{
"response_format": "scalar",
"queries": [
{
"data_source": "cloud_cost",
"name": "query1",
"query": "sum:aws.cost.net.amortized.shared.resources.allocated{aws_product:s3,$aws_account,$region}.rollup(sum, daily)",
"aggregator": "last"
}
],
"formulas": [
{
"formula": "query1"
}
]
}
],
"autoscale": true,
"precision": 2,
"custom_unit": "$",
"timeseries_background": {
"type": "area",
"yaxis": { "include_zero": true }
}
},
"layout": { "x": 6, "y": 0, "width": 2, "height": 2 }
},
{
"definition": {
"title": "Lambda Daily Cost",
"title_size": "16",
"title_align": "left",
"type": "query_value",
"requests": [
{
"response_format": "scalar",
"queries": [
{
"data_source": "cloud_cost",
"name": "query1",
"query": "sum:aws.cost.net.amortized.shared.resources.allocated{aws_product:lambda,$aws_account,$region}.rollup(sum, daily)",
"aggregator": "last"
}
],
"formulas": [
{
"formula": "query1"
}
]
}
],
"autoscale": true,
"precision": 4,
"custom_unit": "$",
"timeseries_background": {
"type": "area",
"yaxis": { "include_zero": true }
}
},
"layout": { "x": 8, "y": 0, "width": 2, "height": 2 }
},
{
"definition": {
"title": "KMS Daily Cost",
"title_size": "16",
"title_align": "left",
"type": "query_value",
"requests": [
{
"response_format": "scalar",
"queries": [
{
"data_source": "cloud_cost",
"name": "query1",
"query": "sum:aws.cost.net.amortized.shared.resources.allocated{aws_product:kms,$aws_account,$region}.rollup(sum, daily)",
"aggregator": "last"
}
],
"formulas": [
{
"formula": "query1"
}
]
}
],
"autoscale": true,
"precision": 2,
"custom_unit": "$",
"timeseries_background": {
"type": "area",
"yaxis": { "include_zero": true }
}
},
"layout": { "x": 10, "y": 0, "width": 2, "height": 2 }
},
{
"definition": {
"title": "Compute vs Observability vs Other Services (Daily Trend)",
"title_size": "16",
"title_align": "left",
"show_legend": true,
"legend_layout": "auto",
"legend_columns": ["avg", "sum", "value"],
"type": "timeseries",
"requests": [
{
"response_format": "timeseries",
"queries": [
{
"data_source": "cloud_cost",
"name": "compute",
"query": "sum:aws.cost.net.amortized.shared.resources.allocated{aws_product:ec2,$aws_account,$region}.rollup(sum, daily)"
},
{
"data_source": "cloud_cost",
"name": "serverless",
"query": "sum:aws.cost.net.amortized.shared.resources.allocated{aws_product:lambda,$aws_account,$region}.rollup(sum, daily)"
},
{
"data_source": "cloud_cost",
"name": "observability",
"query": "sum:aws.cost.net.amortized.shared.resources.allocated{aws_product:cloudwatch,$aws_account,$region}.rollup(sum, daily)"
},
{
"data_source": "cloud_cost",
"name": "networking",
"query": "sum:aws.cost.net.amortized.shared.resources.allocated{aws_product:vpc,$aws_account,$region}.rollup(sum, daily)"
}
],
"formulas": [
{
"alias": "EC2 (Compute)",
"formula": "compute"
},
{
"alias": "Lambda (Serverless)",
"formula": "serverless"
},
{
"alias": "CloudWatch (Observability)",
"formula": "observability"
},
{
"alias": "VPC (Networking)",
"formula": "networking"
}
],
"style": {
"palette": "dog_classic",
"line_type": "solid",
"line_width": "normal"
},
"display_type": "line"
}
],
"yaxis": {
"include_zero": true,
"scale": "linear"
}
},
"layout": { "x": 0, "y": 2, "width": 12, "height": 3 }
}
]
},
"layout": { "x": 0, "y": 23, "width": 12, "height": 6 }
},
{
"definition": {
"title": "External API & Platform Costs",
"background_color": "vivid_pink",
"show_title": true,
"type": "group",
"layout_type": "ordered",
"widgets": [
{
"definition": {
"title": "Anthropic API Cost (MTD)",
"title_size": "16",
"title_align": "left",
"type": "query_value",
"requests": [
{
"response_format": "scalar",
"queries": [
{
"data_source": "cloud_cost",
"name": "query1",
"query": "sum:all.cost{providername:anthropic}.rollup(sum, monthly)",
"aggregator": "sum"
}
],
"formulas": [
{
"formula": "query1"
}
]
}
],
"autoscale": true,
"precision": 2,
"custom_unit": "$"
},
"layout": { "x": 0, "y": 0, "width": 3, "height": 2 }
},
{
"definition": {
"title": "AWS Cost (MTD)",
"title_size": "16",
"title_align": "left",
"type": "query_value",
"requests": [
{
"response_format": "scalar",
"queries": [
{
"data_source": "cloud_cost",
"name": "query1",
"query": "sum:all.cost{providername:aws,$aws_account,$region,$aws_product}.rollup(sum, monthly)",
"aggregator": "sum"
}
],
"formulas": [
{
"formula": "query1"
}
]
}
],
"autoscale": true,
"precision": 2,
"custom_unit": "$"
},
"layout": { "x": 3, "y": 0, "width": 3, "height": 2 }
},
{
"definition": {
"title": "All Providers - Daily Cost Trend",
"title_size": "16",
"title_align": "left",
"show_legend": true,
"legend_layout": "auto",
"legend_columns": ["avg", "sum", "value"],
"type": "timeseries",
"requests": [
{
"response_format": "timeseries",
"queries": [
{
"data_source": "cloud_cost",
"name": "query1",
"query": "sum:all.cost{*} by {providername}.rollup(sum, daily)"
}
],
"formulas": [
{
"formula": "query1"
}
],
"style": {
"palette": "dog_classic",
"line_type": "solid",
"line_width": "normal"
},
"display_type": "bars"
}
],
"yaxis": {
"include_zero": true,
"scale": "linear"
}
},
"layout": { "x": 6, "y": 0, "width": 6, "height": 3 }
},
{
"definition": {
"title": "Cost Split by Provider",
"title_size": "16",
"title_align": "left",
"type": "sunburst",
"requests": [
{
"response_format": "scalar",
"queries": [
{
"data_source": "cloud_cost",
"name": "query1",
"query": "sum:all.cost{*} by {providername}.rollup(sum, monthly)",
"aggregator": "sum"
}
],
"formulas": [
{
"formula": "query1"
}
]
}
],
"legend": {
"type": "automatic"
}
},
"layout": { "x": 0, "y": 2, "width": 6, "height": 3 }
}
]
},
"layout": { "x": 0, "y": 29, "width": 12, "height": 6 }
},
{
"definition": {
"title": "Lambda Cost Analysis",
"background_color": "gray",
"show_title": true,
"type": "group",
"layout_type": "ordered",
"widgets": [
{
"definition": {
"title": "Lambda Estimated Cost (Enhanced Metrics)",
"title_size": "16",
"title_align": "left",
"type": "query_value",
"requests": [
{
"response_format": "scalar",
"queries": [
{
"data_source": "metrics",
"name": "query1",
"query": "sum:aws.lambda.enhanced.estimated_cost{$aws_account,$region}",
"aggregator": "sum"
}
],
"formulas": [
{
"formula": "query1"
}
]
}
],
"autoscale": true,
"precision": 4,
"custom_unit": "$",
"timeseries_background": {
"type": "area",
"yaxis": { "include_zero": true }
}
},
"layout": { "x": 0, "y": 0, "width": 3, "height": 2 }
},
{
"definition": {
"title": "Lambda Cost by Function (Enhanced Metrics)",
"title_size": "16",
"title_align": "left",
"type": "toplist",
"requests": [
{
"response_format": "scalar",
"queries": [
{
"data_source": "metrics",
"name": "query1",
"query": "sum:aws.lambda.enhanced.estimated_cost{$aws_account,$region} by {functionname}",
"aggregator": "sum"
}
],
"formulas": [
{
"formula": "query1",
"limit": {
"count": 10,
"order": "desc"
}
}
]
}
],
"style": {
"display": {
"type": "stacked",
"legend": "automatic"
},
"palette": "datadog16"
}
},
"layout": { "x": 3, "y": 0, "width": 5, "height": 3 }
},
{
"definition": {
"title": "Lambda Cost Trend (Enhanced Metrics)",
"title_size": "16",
"title_align": "left",
"show_legend": true,
"legend_layout": "auto",
"legend_columns": ["avg", "sum", "value"],
"type": "timeseries",
"requests": [
{
"response_format": "timeseries",
"queries": [
{
"data_source": "metrics",
"name": "query1",
"query": "sum:aws.lambda.enhanced.estimated_cost{$aws_account,$region} by {functionname}"
}
],
"formulas": [
{
"formula": "query1"
}
],
"style": {
"palette": "dog_classic",
"line_type": "solid",
"line_width": "normal"
},
"display_type": "area"
}
],
"yaxis": {
"include_zero": true,
"scale": "linear"
}
},
"layout": { "x": 8, "y": 0, "width": 4, "height": 3 }
}
]
},
"layout": { "x": 0, "y": 35, "width": 12, "height": 4 }
}
]
}What MCP Changes — and What It Doesn’t
MCP + AI does change:
How long it takes to build dashboards
How much manual exploration engineers need to do
How consistently dashboards follow best practices
MCP + AI does not change:
The need for domain knowledge
The importance of asking the right questions
The requirement for human validation
This is a force multiplier — not autopilot.
Limitations (Because Reality Matters)
In this example:
Only AWS Cloud Cost Management was configured
Azure and GCP data were not available
Cost allocation tags were incomplete
The dashboard still delivered immediate value, but MCP surfaced these gaps instead of hiding them. That transparency is a feature, not a flaw.
Why This Matters for Real Teams
With MCP access, creating Datadog dashboards no longer has to mean:
Pulling engineers off roadmap work
Rebuilding legacy dashboards blindly
Spending hours validating JSON syntax
Instead, teams can:
Iterate faster
Align on why a dashboard exists
Spend less time on dashboards nobody uses
That’s the real win.
If you’re experimenting with the Datadog MCP Server, the hardest part isn’t generating dashboards — it’s deciding which ones are worth building.
If you want a second set of experienced eyes on your approach, or help applying this workflow to your own Datadog environment, that’s exactly what we do.