
Datadog Troubleshooting Guide — Top 12 Office Hour Questions Answered

Real questions from real engineers—and the fixes our team shared live.
During our December NoBS Datadog Office Hour, engineers brought real production issues—no slides, no agenda, no pitch. This post is a clean recap of the actual questions asked and answers given.
TL;DR — 12 Datadog Problems We Solved Live
If you want the quick hits, here’s what engineers asked—and what we solved in real time:
1. How to Collect Logs from AIX Without a Datadog Agent
AIX isn’t supported by the Datadog Agent—but you can still send logs.
Working options
Syslog forwarding directly to Datadog
Fluent Bit or Fluentd running on an intermediary Linux host
Datadog HTTP Logs Intake API (via curl, Python, shell, cron)
Custom forwarding scripts
This approach is standard for mainframes and legacy operating systems.
Key takeaway:
You don’t need the Agent everywhere—you need a supported ingestion path.
2. Datadog Agent Not Reporting? How to Debug Network and Connection Issues
If your host and application are healthy but Datadog shows gaps, the issue is almost always network transport.
What to check
Outdated Datadog Agent version
Blocked or dropped traffic to *.datadoghq.com
TLS inspection
Corporate proxies
Firewall or IP table rules
Traffic deprioritization in network queues
When the Agent can’t reach Datadog, metrics and traces do not backfill.
Key takeaway:
Data gaps almost always point upstream—Datadog is the symptom, not the cause.
3. How to Collect Datadog Agent Logs for Troubleshooting
To understand why an Agent stops reporting, collect the Agent’s own logs.
Agent log locations
Windows:
C:\ProgramData\Datadog\logs\agent.logLinux / macOS:
/var/log/datadog/agent.log
Recommended approach
Create a custom log configuration inside the Agent’s conf.d directory to ship agent.log into Datadog itself for analysis.
Key takeaway:
If you’re blind to the Agent logs, you’re guessing.
4. How to Enable SQL Server Agent Job Monitoring (agent_jobs)
SQL Server Agent job monitoring requires:
SQL Server 2016 or newer
Datadog Agent v7.57 or newer
agent_jobs.enabled: true in the SQL Server integration config
Required permissions
Your Datadog database user must be able to read from msdb:
sysjobs
sysjobhistory
Docs
Key takeaway:
If permissions aren’t right, Datadog will quietly show nothing.
5. How to Debug APM Instrumentation with DD_TRACE_DEBUG=true
If traces behave unexpectedly, enable tracer debug mode.
How it works
Set:
DD_TRACE_DEBUG=true
This outputs extremely verbose tracer logs.
Warning
Only use debug mode in dev or staging—never production.
While the example here uses Java, tracer debug mode is available across supported Datadog APM languages.
6. Why APM Shows @team Instead of team
@team = span attribute
team = Datadog tag
How to fix it
Add the team tag at the Azure App Service resource level.
Datadog’s Azure integration imports resource tags as real Datadog tags.
If it still doesn’t work, recheck:
Azure integration configuration
Permissions
Resource scope
7. Do Azure Resource Tags Show Up in Datadog APM?
Yes—but only if the Azure integration is configured correctly.
Azure resource tags can propagate to:
APM
Logs
Metrics
Service Catalog
Common reasons tags don’t appear
Resource not in integration scope
Insufficient RBAC permissions
Tag applied to the App Service Plan instead of the App Service
8. How to Centralize Ownership and Team Metadata
We shared three production-grade approaches:
Option 1 — Metadata as code (CI pipelines)
Store ownership metadata in YAML or JSON
Push updates automatically during deploys
Prevents drift across teams
Option 2 — Service Catalog API
Programmatically submit service definitions
Works well for custom workflows
Option 3 — Azure resource tags (recommended)
Azure → Datadog propagation ensures consistent metadata across:
Metrics
Logs
Traces
Services
9. Do Automatically Generated HTTP Client Spans Inherit Tags?
Short answer: not reliably
Some environment-level tags propagate
Cloud resource tags propagate
Custom APM tags may not flow downstream
Recommendation:
Define ownership centrally via:
CI pipelines
Service Catalog
Azure resource tags
10. How to Fix High-Cardinality Custom Metrics (and Reduce Cost)
Use Metrics → Volume to identify problem metrics
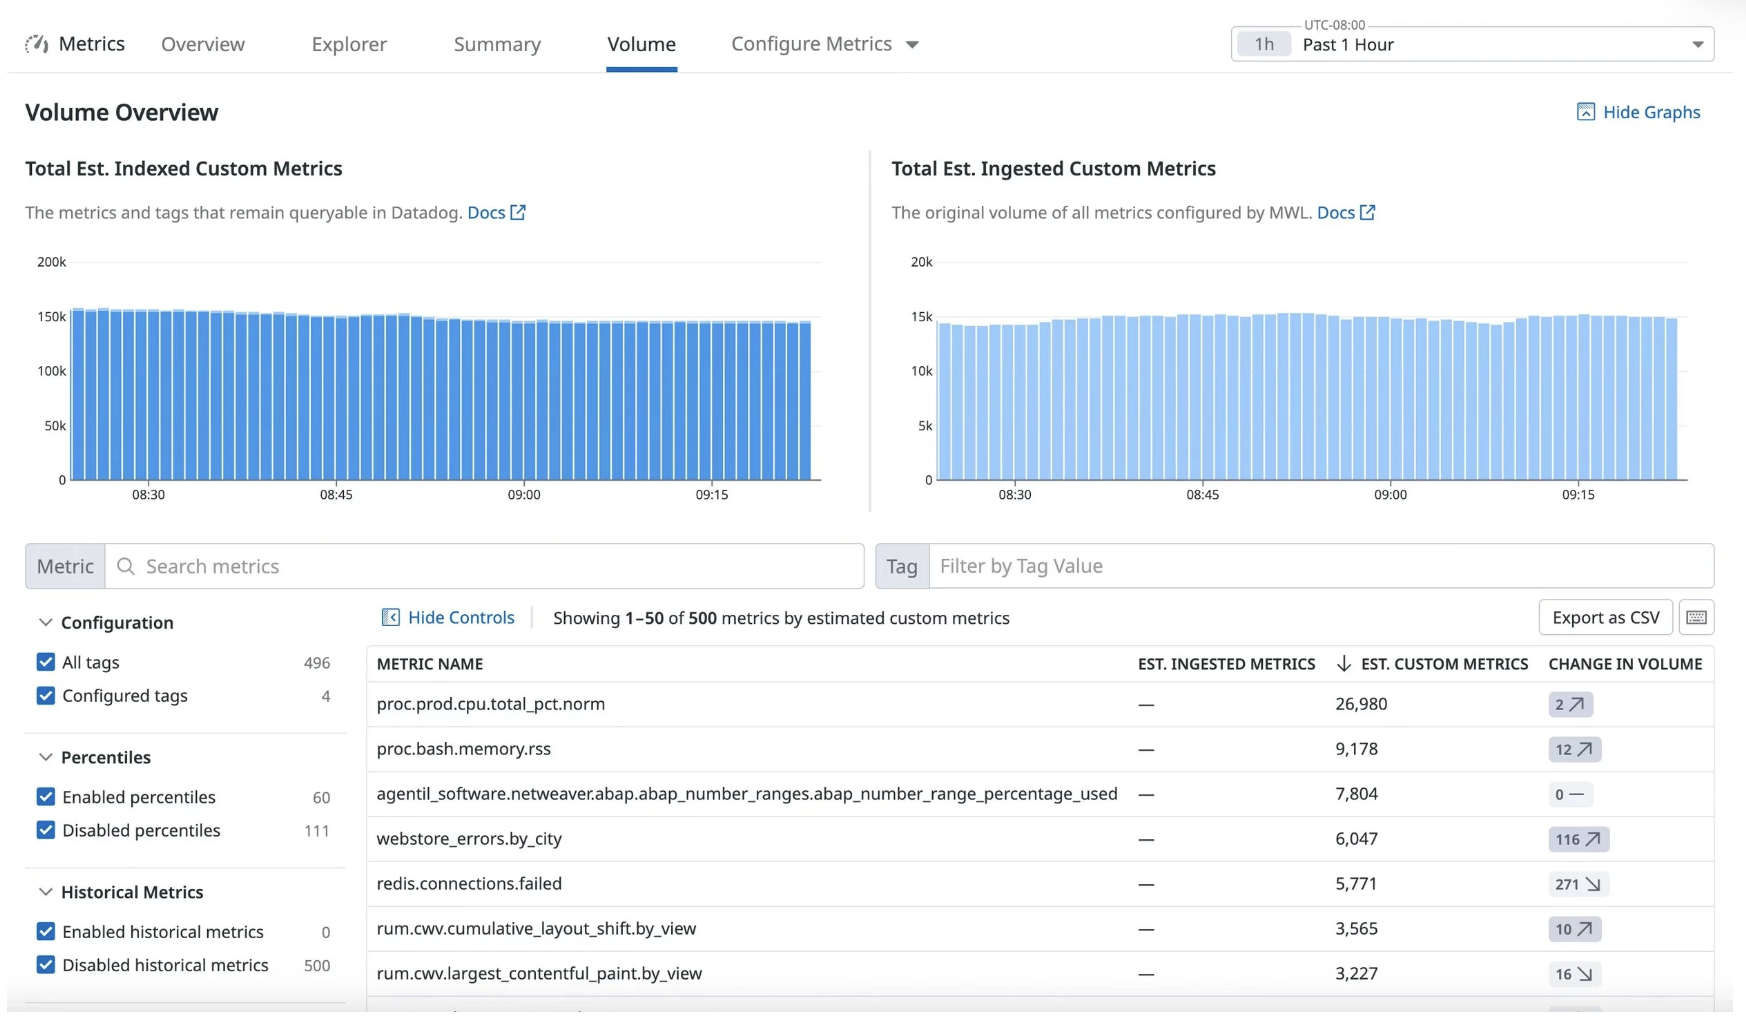
Datadog Metrics → Volume view showing custom metrics with high cardinality and volume impact.
Common offenders
GUIDs
Job run IDs
User or session IDs
IP addresses
OpenTelemetry span.name (when dynamically generated per request)
Any unbounded value set
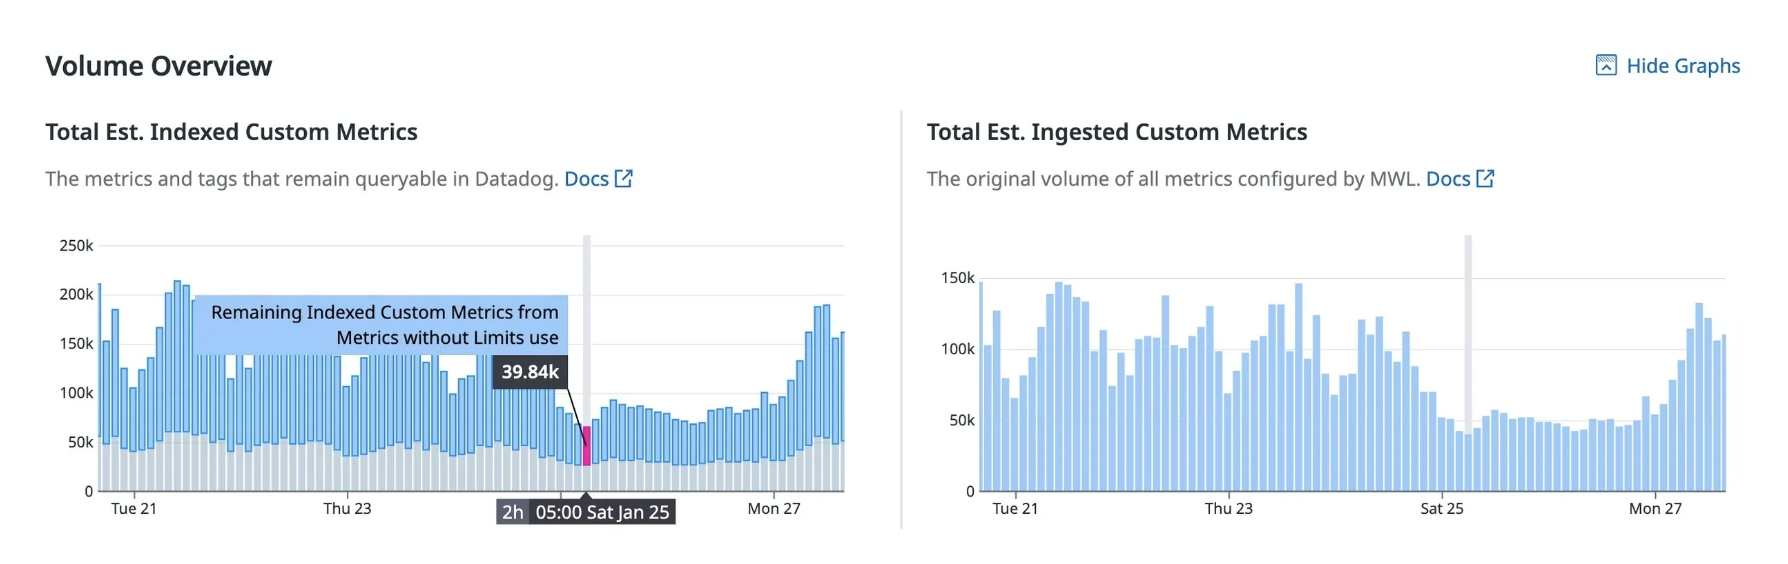
Custom metric volume over time — high-cardinality metrics create sustained cost, not one-time spikes
Fixes
Move unbounded identifiers to logs or traces, not metrics
Convert binary states into numeric metrics (0/1 or counters)
Sanitize ingestion sources (APM, OTEL, custom emitters)
Key takeaway:
Metrics are for aggregation. Logs are for uniqueness.
11. Are My Latency Spikes Real?
Distribution metrics help distinguish:
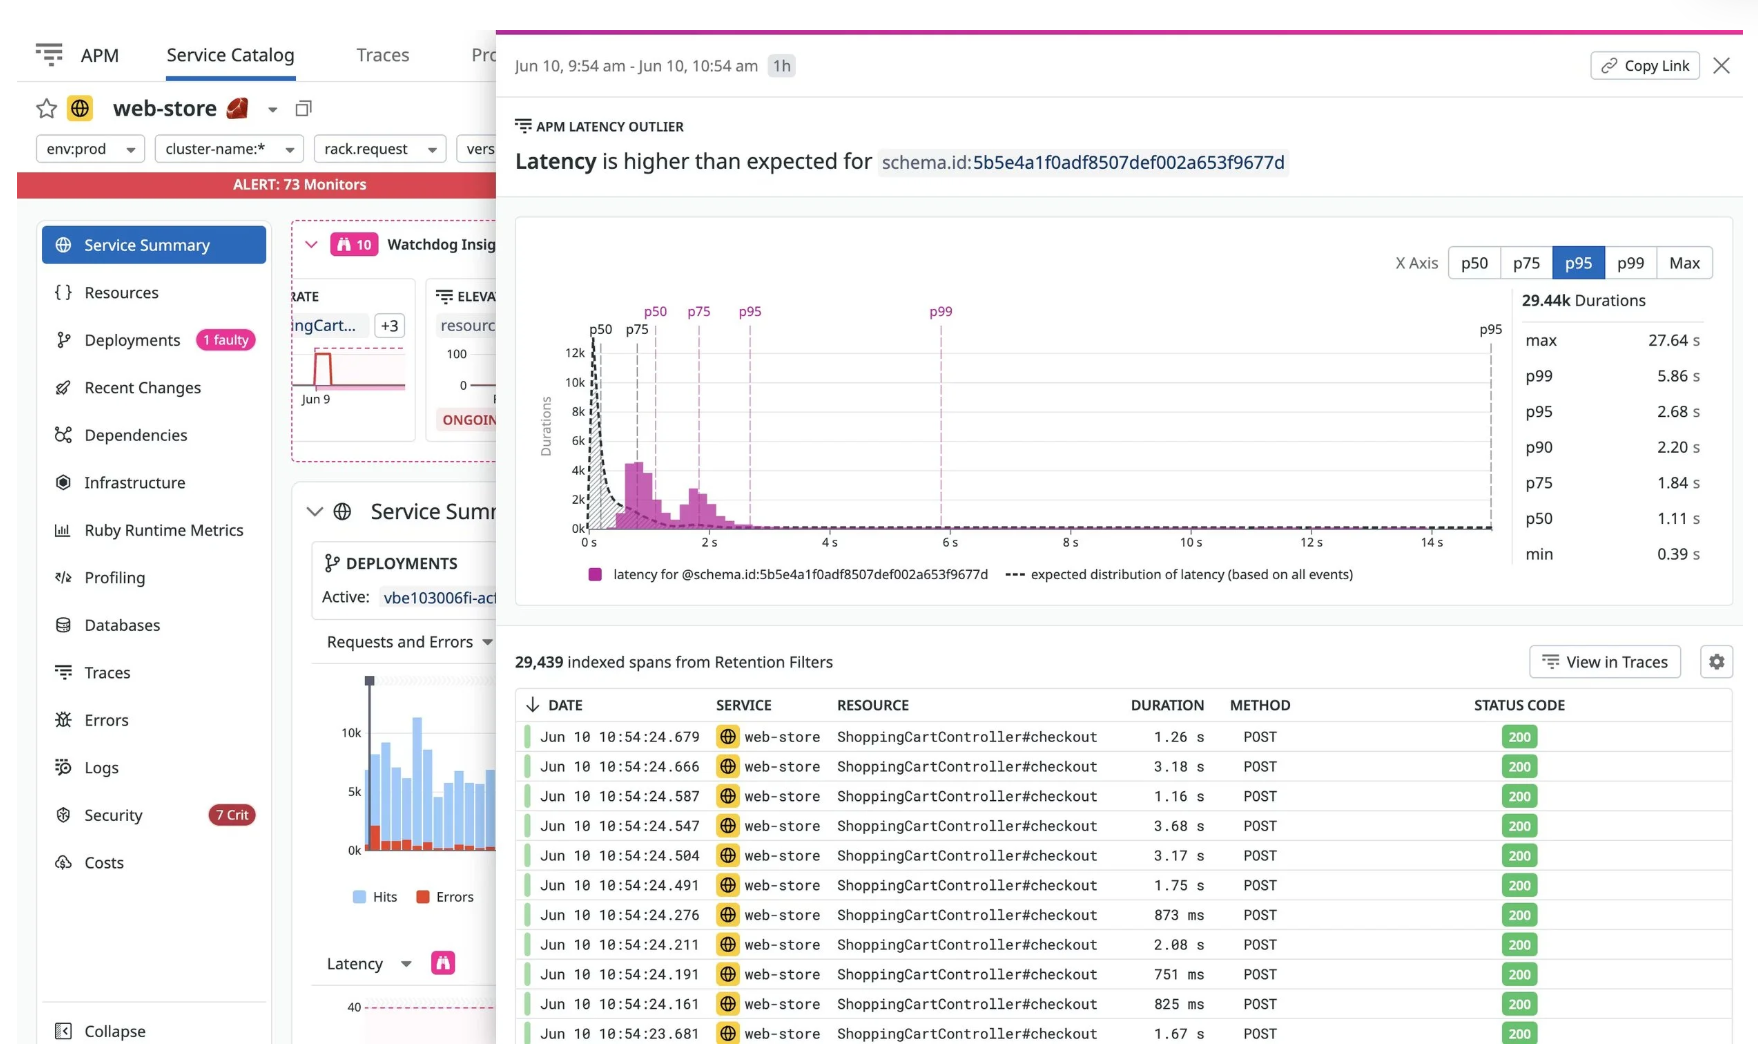
One or a small number of slow requests
From a real systemic slowdown
What to use
p50 / p75 / p90 / p95 / p99
Distribution buckets
Correlated traces
Key takeaway:
A scary average doesn’t automatically mean an outage.
12. Best Practices for Azure App Service Monitoring
What the NoBS engineering team consistently recommends:
Use Azure resource tags for metadata
Enforce tagging via CI pipelines
Use tracer debug logs for instrumentation issues
Treat the Service Catalog as the source of truth
Azure is easiest when metadata lives at the cloud-resource layer—Datadog handles the rest.
FAQ — Quick Answers
Why is my Datadog Agent not reporting metrics?
Most commonly outbound network transport issues—firewalls, proxies, TLS inspection, or traffic deprioritization.
Can Datadog recover data if the Agent is down?
No. Metrics and traces cannot be backfilled—only logs may resume from checkpoints.
How do I reduce Datadog custom metric cost?
Remove unbounded tags and use Metrics → Volume to find high-cardinality offenders.
How do I enable SQL Server Agent job monitoring in Datadog?
Enable agent_jobs in the SQL Server integration and grant read access to msdb.
Why does my team tag appear as @team?
Because it’s an attribute. Add the tag at the Azure resource level to convert it into a real Datadog tag.
Want help with Datadog?
Have a question not covered above? Or want to share some of your own experiences? Drop in the comments: