Using AI and Datadog Dynamic Instrumentation to Find Hidden Application Latency

Have you ever seen a trace like this, and wondered exactly where this time is going?
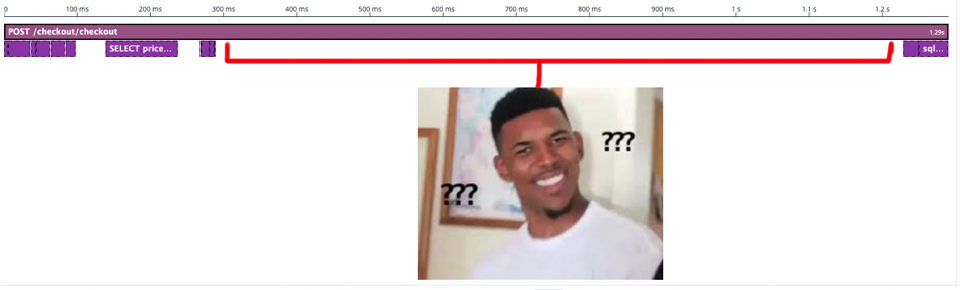
Distributed tracing out of the box is typically going to show us the communication pathways and timings between multiple services, but not exactly what the code is doing outside of that. Profiling can be used for that kind of thing, but during an incident, digging through profiles and trying to align timings on traces can lead down rabbit holes in the wrong direction.
Going further down the incident rabbit hole, it might also not be possible to add custom instrumentation to an application and get it deployed for several reasons; deploying could potentially make things worse, instrumentation can be complicated to do properly, deployment pipelines may be slow or restricted, or any other number of reasons that might make determining what this gap is unfeasible.
I’ve written a blog on dynamic instrumentation in Datadog before, but during a recent hackathon, I decided to take this a few steps further. Adding Datadog Dynamic Instrumentation in this sort of situation itself isn’t the hard part; analyzing where these “gaps” live, which functions need the instrumentation, and determining if we were able to find the gaps is the hard part. This is where my buddy Claude comes in.
How the AI Latency Investigation Worked
To solve this problem, I did a few things:
Finding the Trace Gap and Forming a Hypothesis
Set up the Datadog MCP Server to allow Claude to query these traces.
Created a skill called dd-trace-rca that uses the MCP Server to find the gaps, explore the codebase for candidates that could be part of these gaps, and form a root-cause hypothesis.
Adding Dynamic Instrumentation in Datadog
This hypothesis is given to another skill, dd-dynamic-instrumentation, which knows how to create the required dynamic spans, and uses Claude in Chrome to control the browser and instrument the application live in Datadog.

Validating the Hypothesis with New Trace Data
When the instrumentation is completed, there is a wait period of ~90 seconds to allow it to take effect.
Lastly, a skill called dd-hypothesis-verdict inspects the traces again to determine if the instrumentation added accounts for the “gaps”, and whether the hypothesis should be accepted or rejected.
A report of the process, findings, and recommendations for actual remediation of the slowdown is provided.
All of this is wrapped together in one skill, so we can simply say “run a latency investigation on the checkout-service,” and the full workflow starts.
What the Dynamic Instrumentation Found
The new compute_pricing span accounted for 1,475 milliseconds, or 94.9% of the total request duration.

In this specific example, Claude hypothesized that there was a function running a quadratic Big O notation operation (O(n_items² × coupon_count)) that was the cause of this issue, and it proved to be correct with the dynamic spans in place.

The Tradeoffs of Using AI for Dynamic Instrumentation
There is, of course, a downside to this process. Claude in Chrome takes forever because of how it operates. It runs a step, takes a screenshot of the state, analyzes what to do next, does it, takes a screenshot of the state… and so on. The investigations (the hypothesis and findings) only took about one minute each. The actual instrumentation using Claude in Chrome took about nine minutes to add two spans. It’s… not the fastest. However, there is certainly something to be said about the entire process knowing what it’s looking into, having context of what was done, and then proving or disproving itself until it finds what it is looking for. Is it possible for a human to be faster than this? On the instrumentation side of things in the browser, absolutely; though that assumes that the user knows exactly what they are doing and where. Would a human be faster and be able to easily identify exponential operations in a large codebase? Generally unlikely, though possible. So we’re ultimately talking about tradeoffs here. The other consideration to make is that this process could be easily modified to have Claude spit out where the spans need to be added and how to do it.
When This Workflow Is Actually Practical
All in all, is this something practical to do? Admittedly I’m on the fence about it, but as always, it depends. Would I do this if an issue was identified right after a production rollout and spend fifteen to twenty minutes investigating it to then have to actually make the code changes and push it out? Nah, I’m rolling back that change to the last stable version and then diagnosing in the background. Is this something that I would do if we were doing an investigation of a longer-standing issue, or something that was happening occasionally? Absolutely. If the problem has already existed for some time and I can kick this off in the background while I’m doing something else, that’s a win.
Token Usage and Cost
The last thing regarding practicality…tokens. Of course, your mileage will vary here depending on the size of the codebase, the number of spans analyzed, the depth of instrumentation, and the number of iterations. This particular example took approximately 26k input tokens and 86k output tokens (on Opus 4.8), so just over two dollars in output tokens and less than twenty cents in input tokens. On a Max/Team plan, this usage is hardly noticeable, but could certainly be noticeable if you’re on usage-based pricing and running this frequently on very complex problems.
Want to find out what else we’re doing with Datadog and Claude? Get in touch.
FAQ: AI, Datadog Dynamic Instrumentation, and Application Latency
Last updated: July 22, 2026
What problem does this workflow solve?
Distributed tracing shows the communication paths and timings between services, but time spent in code that has not been instrumented may not be attributed to a specific span. Profiling can help fill that in, but during an incident, digging through profiles and aligning them with trace timings can send you down the wrong rabbit hole.
Adding custom instrumentation to find the answer is not always practical mid-incident. A deployment could make the problem worse, instrumentation takes time to get right, and pipelines may be too slow or restricted to help in the moment.
How does Claude find the unexplained time in a trace?
The Datadog MCP Server is set up so Claude can query Datadog trace data. A skill called dd-trace-rca uses that access to locate unexplained time in a trace, explore the codebase for likely code paths, and form a root-cause hypothesis.
Finding the gap and forming a useful hypothesis is the hard part of the process. Adding the instrumentation itself, once you know where to look, is comparatively simple.
How is Dynamic Instrumentation added?
Once a hypothesis exists, the workflow passes it to a second skill, dd-dynamic-instrumentation, which knows how to configure Dynamic Instrumentation in Datadog. It uses the Claude in Chrome extension to control the browser and add targeted spans through the Datadog UI for the running application.
After the spans are created, the workflow waits about 90 seconds for the instrumentation to take effect before evaluating the new trace data.
How does the workflow test the hypothesis?
A third skill, dd-hypothesis-verdict, inspects the traces again after the new spans appear and checks whether they account for the missing time identified in the first step. It then produces a report covering the investigation, its findings, and recommended remediation.
In the example covered in the post, Claude identified a code path with O(n_items² × coupon_count) time complexity. The new compute_pricing span accounted for 1,475 milliseconds, or 94.9% of the total request duration, confirming the hypothesis.
How fast is Claude in Chrome at adding the instrumentation?
Not particularly. Claude in Chrome works by performing a step, taking a screenshot, analyzing what to do next, and repeating the process. The hypothesis and verdict stages each took about one minute, but the browser-driven instrumentation step took roughly nine minutes to add two spans.
A human could likely add the spans faster in the browser if they already knew exactly where and how to instrument the application. Identifying the right code paths and deciding where to add those spans is the harder part of the investigation.
When is this workflow actually practical?
For something urgent right after a production rollout, rolling back to the last stable version is still the faster call. Spending fifteen to twenty minutes investigating before pushing a fix is not the right tradeoff in that situation.
For a longer-standing or intermittent issue, it is a much better fit. The investigation can run in the background while you work on something else, which is where this approach becomes useful.
How many tokens did this investigation use?
The example used approximately 26k input tokens and 86k output tokens on Opus 4.8. Based on the API pricing used for the estimate in the post, that equated to just over two dollars in output tokens and less than twenty cents in input tokens.
Actual billing depends on how Claude is accessed. On Max and Team plans, the run counts against the plan's usage limits rather than appearing as a separate per-token charge. With usage-based API pricing, repeated runs against complex codebases can add up.