APM vs USM in Datadog: How to Choose (and When You Can’t)
When we think about all of the tools that Datadog has to offer, sometimes there are clear choices and sometimes those choices aren’t so clear. An area that we see some questions in is usually around application monitoring - a common question is “what’s the difference between APM and USM and when would we use them”? This is a great question, since at a surface level, it seems like they might do the same thing. You’d be close, but not quite right. But, there are areas where either can shine and be extremely useful, and areas where either can be a no-go.
To start off - acronyms are great and we’ll keep using them, but before we dive too deep - APM is Application Performance Monitoring, and USM is Universal Service Monitoring. Back to acronyms.
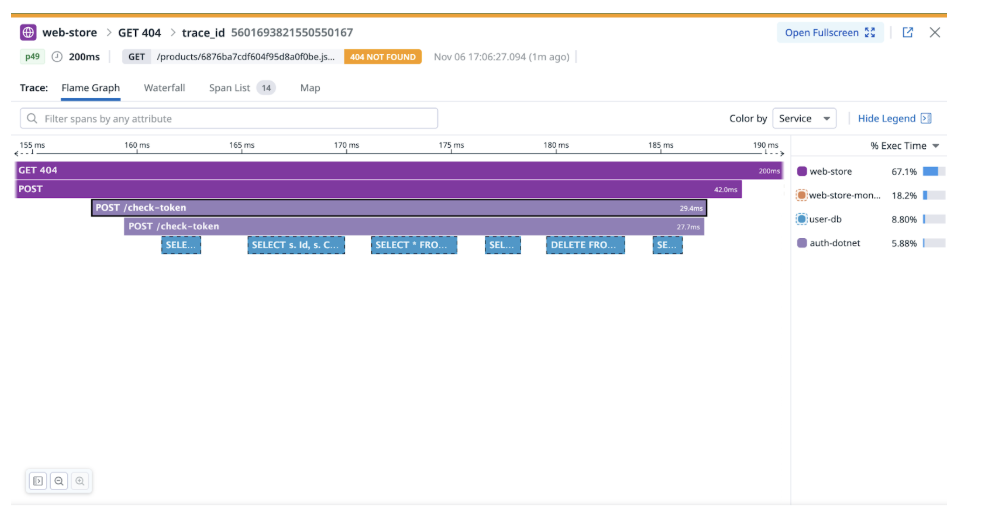
At the end of the day APM is going to be preferable in pretty much every case. This gives us the most insight into our applications - who they’re talking to, pathways through queues, database queries, and so on. It’s by far the most holistic way to understand what your applications are doing AND what they’re doing together. The downside here is that only a certain number of languages are supported (to be fair, the most common in the industry) and that you have to do instrumentation in some fashion. While the instrumentation has become a lot easier these days, there are also worlds where it’s not an easy addition based on slower or restricted release cycles for some organizations.
If you’re trying to understand whether your current APM setup is giving you enough visibility, our Datadog Reality Check can validate your configuration and surface blind spots.
So, if APM is “preferable in pretty much every case” - where does USM come in? First of all, let’s talk about what it actually is. USM uses a technology called eBPF - without going into a whitepaper about it, for all intents and purposes it allows us to sniff traffic at the kernel level to produce data without touching the code. Neat! We can see HTTP requests to individual endpoints and use that to understand the request rate, error rate, and response times. In other words - your golden signals without code changes. Well, two use cases were already mentioned - if you have a software release cycle that’s very long and can’t get the changes for APM out there, USM just requires a Datadog agent installation and a config change. And then it's there, and it works. It can be an easy stop-gap solution until you’re able to get that change out there to still understand your golden metrics and application health. The other use case is that it’s language agnostic. USM does not care if it’s Java, Erlang, or C - if it responds to HTTP, USM will track it. This also means that you can monitor the health of third-party/COTS/black-box applications without having access to the source code. The only real trick here is that you need a modern Linux Kernel or Windows version. So if you’re still trying to get golden metrics on a FORTRAN application running on an IBM mainframe, you’re still out of luck.
Let’s say we’re still out of luck - what can we do? We once had a customer that was running a very old version of PHP not supported by Datadog APM that was running it on an operating system that USM wouldn’t support either but wanted their golden metrics. The good news is that Apache has an access log which shows items like the URI path, response code, and response duration in a known format that can be easily processed. So - we collected those logs, set up a grok parser, excluded them from log indexing, and converted them into metrics. Golden ones!
Do you have a situation where you’re still unsure of what to use, or how to get the valuable data you need?
Get in touch with NoBS or email - sales@nobs.tech
FAQ: Datadog APM vs USM (NoBS)
Last updated: 2025-11-12
What’s the real difference between APM and USM?
APM is code-level tracing: spans, services, dependency maps, DB queries, queues—deep context across requests. It requires instrumentation in supported languages. USM uses eBPF/OS-level network visibility to auto-discover services and capture RED (requests, errors, duration) on HTTP(S) endpoints with no code changes. Think: traces for depth (APM) vs kernel-powered golden signals for breadth (USM).
When should I choose APM over USM?
Choose APM by default when you can instrument. You’ll get end-to-end traces, service pathways, query timings, and richer debugging/alerting. If you’re investigating latency spikes, cross-service issues, or need business-level tracing (e.g., request IDs through queues), APM is the right tool.
When does USM make more sense?
Use USM when release cycles are slow, code changes are restricted, the language isn’t supported, or you need fast coverage across many services. USM gives request rate, error rate, and latency now (agent + config), and it’s a solid stop-gap until you can ship APM.
How do I monitor legacy or third-party apps I can’t instrument?
Try USM first (modern Linux/Windows required). If the OS/kernel isn’t supported, use a logs → metrics workaround: parse web server/access logs (URI, status, duration) with a processor (e.g., grok), exclude from indexing to control cost, and emit derived metrics for your golden signals. It’s not tracing, but you’ll still see health trends.
Any gotchas or cost tips when choosing APM vs USM?
Requirements: USM needs a modern kernel/OS; visibility is focused on HTTP(S) behavior (no code-level spans). Hygiene: use path replacement/filters to tame noisy endpoints. Cost control: APM offers sampling and selective instrumentation; USM generates lightweight service metrics for broad coverage. Many teams run USM for coverage + APM where depth matters.


