

Netflix fairly recently published a deep dive on building their service topology system, the live map of how their services depend on each other. It's a good read, and they walk through a lot of hard engineering. There's streaming aggregation from multi-region Kafka, and a pipeline that resolves load balancers and proxies out of the graph. They even built time travel queries that let an engineer ask what the call graph looked like at the moment an incident happened.
For a lot of teams the part worth emulating comes before any of that pipeline work. Netflix built their map from three separate data sources on purpose. They pulled from eBPF network flows, their service level metrics (the IPC layer), and distributed traces. Those stayed in separate graph layers and got merged at query time.
Why One Feed Isn't Enough
Netflix used three because no single feed gives you a complete map. Traces show the actual request path, but only for the services you've instrumented, and they're sampled on top of that. Network flows see everything on the wire, but they lack application context, so you get IP to IP hops instead of real service to service edges. Service level metrics carry rich detail, but again only for the services you've instrumented. Each one has its own blind spot, and they don't line up.
As Netflix's post puts it, during a 3am incident "an hour-old dependency map is archaeology, not observability." That line is about stale data, but a map with gaps in coverage fails the same way. It looks authoritative while it is quietly wrong about what depends on what.
You can build a decent looking map from one feed and it will demo well. Where things begin to fall apart is when a real incident starts at an edge that the feed can't see. It's the managed database, or the third-party payment API, or the one legacy service no one ever instrumented. We worked with a team whose map couldn't show the hop from an app to its own database, even for a single service. When they went looking for the cause, it wasn't an issue with the tooling. Their older instrumentation had been rolled out without a consistent tagging standard,so the layers that should have joined up had nothing to join on.
How Datadog Covers the Dependency Gaps
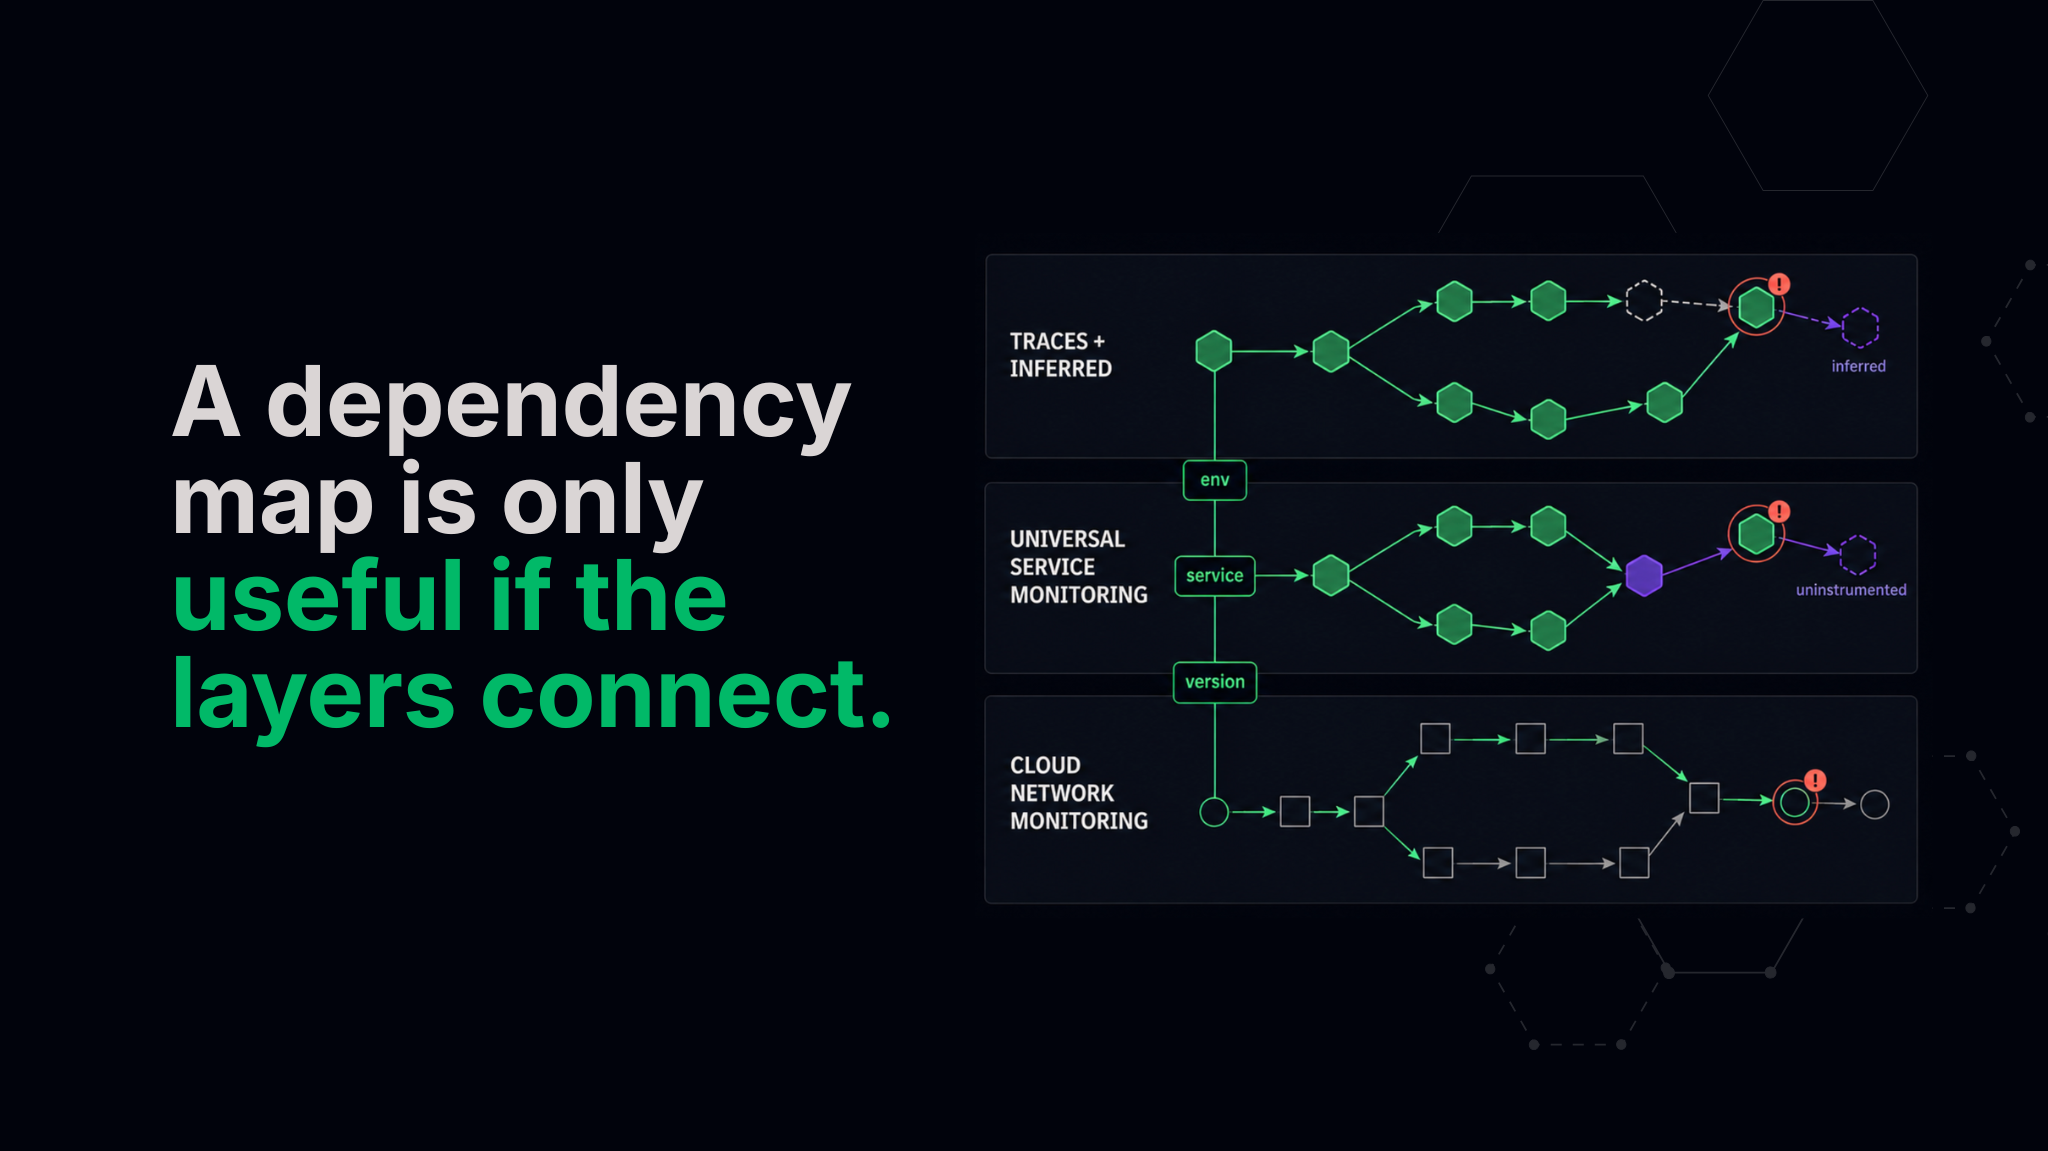
You don't have to build any of that pipeline to get out of that situation. The three feeds Netflix combined map onto layers Datadog already runs. Your traces and Datadog's inferred dependencies cover the services you own and the things they call. Universal Service Monitoring reports request counts, errors and latency for the services no one instrumented. Cloud Network Monitoring reads the flows that are underneath all of it off the wire.
The first three merge into one graph. They feed Datadog's Service Map and the Catalog's dependency graph with no pipeline work on your part. Cloud Network Monitoring stays in its own view, the Network Map, and you cross between the two on shared tags. That ends the argument over which of your monitoring tools holds the real topology. Whether they line up at all depends on your tagging, so that's worth settling first.
Get Your Tagging Right First
The first thing you absolutely need to get right is Unified Service Tagging. Datadog ties telemetry together with three reserved tags: env, service, and version. Set them through DD_ENV, DD_SERVICE and DD_VERSION before the process starts. Universal Service Monitoring needs env at minimum, and it picks up service names from those variables as the process comes up. Skip this and you get four streams of telemetry that never merge into one graph. That team had been living with exactly that failure.
Build the Map One Layer at a Time
From here the layers are configuration work. Turn them on in the order of what each one buys you, and you can stop after any one of them and still be better off than you were.
Service Map
Begin with what you already have. The Service Map is built from your traces and shows the observed dependencies between your services in real time. Services closer to your customers sit on the left, and the ones more likely to be root causes sit on the right. Scope it to a time range and point it at the window an incident happened in. That covers the services you own and instrument, and nothing else.
Inferred Services
Then take the edges you know you'll never instrument, like third party services, because they aren't yours. Datadog infers those from the outbound requests your instrumented services make. That's your Postgres and your Kafka, your S3 buckets and your calls out to Stripe. On Agent 7.60.0 and later this is on by default, which makes it the easiest layer to add. On an older Agent between 7.55.1 and 7.59.1, you set compute_stats_by_span_kind and peer_tags_aggregation to true under apm_config in datadog.yaml.
Universal Service Monitoring
Next comes that legacy service no one ever instrumented. Universal Service Monitoring picks it up from the Datadog Agent alone, with no code changes. It reports the golden signals of request counts, errors and latency. You need Agent 6.40 or 7.40 and above, and it runs on Datadog's system-probe. Turn it on with DD_SYSTEM_PROBE_SERVICE_MONITORING_ENABLED=true or it’s equivalent depending on how you deployed the service. The service then appears on the same Service Map and in the Catalog, right next to the ones you did instrument.
Cloud Network Monitoring
Last are the network hops that never showed up in a trace to begin with. Cloud Network Monitoring reads them straight off the wire using eBPF in the Linux kernel, with nothing to instrument. It needs Agent 6.14 and above on kernel 4.4.0 and above, enabled with network_config: enabled: true in system-probe.yaml. Windows uses a kernel driver instead and wants Agent 7.27.1. This layer lines up one for one with Netflix's eBPF flow logs, and it catches DNS along with the traffic between systems you don't own.
Verify the Map Before You Trust It
Turning these on isn't the same as having a map you can trust, so go verify the specific failure you're trying to avoid. Scope the Service Map to a recent window and click into a service you know talks to a database. Inspecting it isolates that service and shows both the requests it receives and the calls it sends, so the database edge is either there or it isn't. Do the same for one uninstrumented service and confirm it reached the Catalog.
The wire data gives you a second angle on the same question. CNM comes with its own Network Map view of the raw traffic. Group that by service and look for traffic to destinations with no counterpart on the Service Map. Anything you find there is a dependency your trace layer can't see.
Know the Limits of Your Dependency Map
A few limits apply to CNM specifically. It covers Windows hosts but not Windows containers, and DNS resolution isn't available on CentOS or RHEL 7.6. Datadog also recommends running it on a meaningful subset of your infrastructure, so treat it as a targeted rollout.
Two more apply to the whole map once you're using it. Your traces are still sampled, so the other three layers are also doing real work. Keep in mind that retention will catch you during an incident, since services age out of the Service Map after 30 days without traces. That means time scoping is not fully like Netflix's time travel and won't reach an incident older than a month.
Using the Map During an Incident
When you get paged, you scope the map to the incident window and start at the service that's failing. You can see the calls it receives and the requests it sends, and follow the failure outward from there. Because every layer feeds the same map, that path doesn't stop when it reaches the managed database or the call out to Stripe. The edge where the incident actually started is right there on the map, whether or not you ever instrumented it.
Netflix built the pipeline because their scale and custom infrastructure left them no viable option, and most of that work went into fighting production, not drawing the actual graph. The graph itself is the dependency map you should be able to trust during an incident, and what’s cool with Datadog is it’s something you can just turn on rather than have to build yourself.
FAQ: Building a Datadog Dependency Map
Last updated: September 9, 2026
What is a dependency map in Datadog?
A dependency map shows how services communicate with each other and the infrastructure, databases, queues, and third-party systems they depend on.
In Datadog, traces and inferred dependencies, Universal Service Monitoring, and Cloud Network Monitoring give you complementary views of service and network dependencies. The Service Map covers application dependencies, while the Network Map gives you a network-level view that can expose traffic the trace layer cannot see.
Why isn't one data source enough to map service dependencies?
Every data source has a blind spot. Traces show actual requests, but only for instrumented services and sampled traffic. Network flow data sees what moves across the wire, but it lacks the application context needed to identify service-to-service relationships on its own. Service-level metrics provide useful context but are also limited to the services being monitored.
Using multiple layers gives you a more reliable map and makes it less likely that an uninstrumented service, managed database, or third-party API will remain invisible during an incident.
Which Datadog features are used to build the dependency map?
Start with the Service Map and inferred services from your trace data. The Service Map shows observed dependencies between instrumented services, while inferred services add dependencies such as PostgreSQL, Kafka, Amazon S3, and external APIs that your services call but may not directly instrument.
Universal Service Monitoring adds services that are running without trace instrumentation. Cloud Network Monitoring then provides a network-level view that can reveal traffic and destinations missing from the Service Map.
Why is consistent tagging important for a Datadog dependency map?
Consistent tagging gives Datadog a shared service identity across telemetry sources. Datadog's Unified Service Tagging uses the reserved env, service, and version tags so traces, metrics, logs, and other telemetry can be associated with the same service.
If the same service appears under different names or tags, its telemetry can show up as disconnected or duplicate services. For Universal Service Monitoring, make sure the required env tag is applied and that service naming stays consistent with the rest of your telemetry.
How do I verify that my Datadog dependency map is accurate?
Scope the Service Map to a recent time window and select a service that you know communicates with a database or another service. Inspect the selected service to confirm that the expected requests and dependencies appear.
Then compare the Service Map with the Network Map. Traffic going to a destination with no corresponding service may point to missing instrumentation, inconsistent tagging, or a dependency that has not been identified elsewhere.
What limitations should I know about before relying on the map?
Cloud Network Monitoring supports Windows hosts but not Windows containers, and DNS resolution is not available on CentOS or RHEL 7.6. Datadog also recommends enabling it on a meaningful subset of your infrastructure instead of treating it as an all-or-nothing rollout.
Traces are still sampled, and services without recent traces can disappear from the Service Map after 30 days. The map improves visibility across your environment, but it does not provide unlimited historical reconstruction.
How do I use the dependency map during an incident?
Scope the map to the incident window and begin with the service that is failing. Review the calls it receives and the requests it sends, then follow the failure outward to identify where the behavior changes.
Using the Service Map together with the Network Map gives you another path when the incident reaches a managed database, third-party API, or service that was never directly instrumented. The dependency involved in the failure may be somewhere your tracing alone could not see.
