
Back in the first post of this series I said that if you want to talk about the various depths of mathematical infinity, buckle up for a few hours, bucko. Nobody took me up on it, so I'm doing it anyway. If you're new here, my name is Nick, and I have a weird brain that understands complicated things easily and trips over simple ones, so the way I learn a simple thing is to overcomplicate it until it finally makes sense.
Today's simple thing is cardinality. The Datadog definition fits in one sentence: it's the number of unique tag value combinations on a metric. That's it. That's the whole concept. It's also the reason for a pretty sizable chunk of the surprise invoices I get asked to look at, which tells me the one sentence version isn't doing its job. It's too damn simple, so let's make it worse.
Quick question before we do: how many distinct values does your request_id tag have? Or user_id? Take a second. The honest answer is "all of them, and more tomorrow", and you are paying for every single one. To explain why, I need a hotel.
Hilbert’s Hotel: Always Room for One More
The hotel is from a mathematician named David Hilbert, and it has infinitely many rooms, numbered 1, 2, 3 and so on forever. Every room is occupied. A guest walks in and asks for a room, and at a normal hotel that's a "sorry, we're full". At this one, the manager asks every guest to move up one room - room 1 goes to room 2, room 2 goes to room 3, room n goes to room n+1 - and room 1 is now empty. Full hotel, new guest, no problem.
Then a bus pulls up with infinitely many passengers. Still fine. The manager asks every guest to move to the room number that's double their own, so room n goes to room 2n. Everybody now lives in an even numbered room, every odd numbered room is empty, and there are infinitely many of those, so the whole bus gets a bed.
The lesson people usually take from this is that infinity is weird and it always fits. That's true, and it's also exactly how a metrics backend feels from the outside. You send Datadog a new tag value and it doesn't push back, it doesn't say "sorry, we're full", it just finds a room. The part the thought experiment leaves out is that the hotel bills by the room. "It fits" was never the problem.
The mathematician who worked out how to count the guests in a hotel like that was Georg Cantor, and the word he used for the size of a set is cardinality. Same word. For a finite set it's just the count - the set {dev, staging, prod} has a cardinality of 3. For infinite sets you can't count, so Cantor's rule is that two sets are the same size if you can pair their members up one to one with nobody left over. That's what the manager is doing with the bus: pairing passengers with odd numbered rooms. It works, so the two sets are the same size, even though one of them looks like "half" of the other.
Now here's Datadog's version, straight out of the custom metrics billing docs:
“A custom metric is uniquely identified by a combination of a metric name and tag values (including the host tag).”
That's a set, and your bill is its cardinality. Not as a metaphor, either - it's literally the same definition. (Datadog has two billing models for custom metrics now. This is the original one, and I'll get to the new one in a minute, because its name is too good to skip.) Datadog counts the distinct combinations that show up in each hour, averages that across the month, and that number is your billable custom metrics. How often you submit doesn't matter and how often you query doesn't matter. The only thing that matters is how many rooms are occupied.
How Datadog Metric Cardinality Actually Adds Up
So how do you end up with a lot of rooms? The explanation everybody gives (me included, for years) is multiplication. Every tag you add multiplies the number of possible combinations:
| Tags on the metric | Distinct values added | Total series |
|---|---|---|
env |
3 | 3 |
+service
|
40 | 120 |
+endpoint
|
80 | 9,600 |
+customer_id
|
5,000 | 48,000,000 |
Forty eight million. That's a great slide. It's also the kind of number that makes me suspicious, because I've never actually seen a single metric do that, and "trust the slide" is not how we do things around here. So I wrote a little script that fakes one hour of traffic at 100 requests per second, with those same tags, and then counts distinct combinations the way Datadog does - only the ones that actually reported.
requests in the hour: 360,000
| tags on the metric | ceiling (multiply) | actually reported |
|---|---|---|
| env | 3 | 3 |
| + service | 120 | 120 |
| + endpoint | 9,600 | 240 |
| + customer_id | 48,000,000 | 124,710 |
| + request_id | 17,280,000,000,000 | 360,000 |
Well would you look at that. The multiplication table is a ceiling, and reality sits a long way under it.
The first place it breaks is endpoint. I've got 80 endpoints, but each one belongs to exactly one service, so svc-07 is never going to report /svc-12/a. Adding the tag doubled the count (two endpoints per service) instead of multiplying it by 80. The docs call this out with a temperature example where adding state to a metric that's already tagged by city costs you nothing, because a city already tells you the state. Tags that are just a rollup of a tag you already have are free.
The second place is customer_id. The ceiling says 48 million, the hour says 124,710. That's still 520 times more than we had one row earlier, so I wouldn't call it good news, but look at the last row for what's really going on. There were only 360,000 requests in the hour. A tag combination only exists if something reported it, and each request reports exactly one, so you cannot have more tag combinations than you have data points. The ceiling stopped mattering a while ago, and the thing that actually limits your bill is how much traffic you have.
Which brings us to request_id, the row that hits that limit dead on. 360,000 requests, 360,000 series, and every one of them contains exactly one data point. A time series with one point in it isn't a time series. It's a log line that you paid metric prices for. And the next hour you get 360,000 brand new ones, because none of those request IDs are ever coming back. That's Hilbert's bus, pulling up every hour on the hour, and the manager keeps finding rooms.
(That limit is on tag combinations, and the bill can actually be worse than that. If the metric is a distribution, Datadog counts five custom metrics for every combination - count, sum, min, max and avg - so one request with a unique ID bills as five. If you turned on percentiles, it bills as ten.)
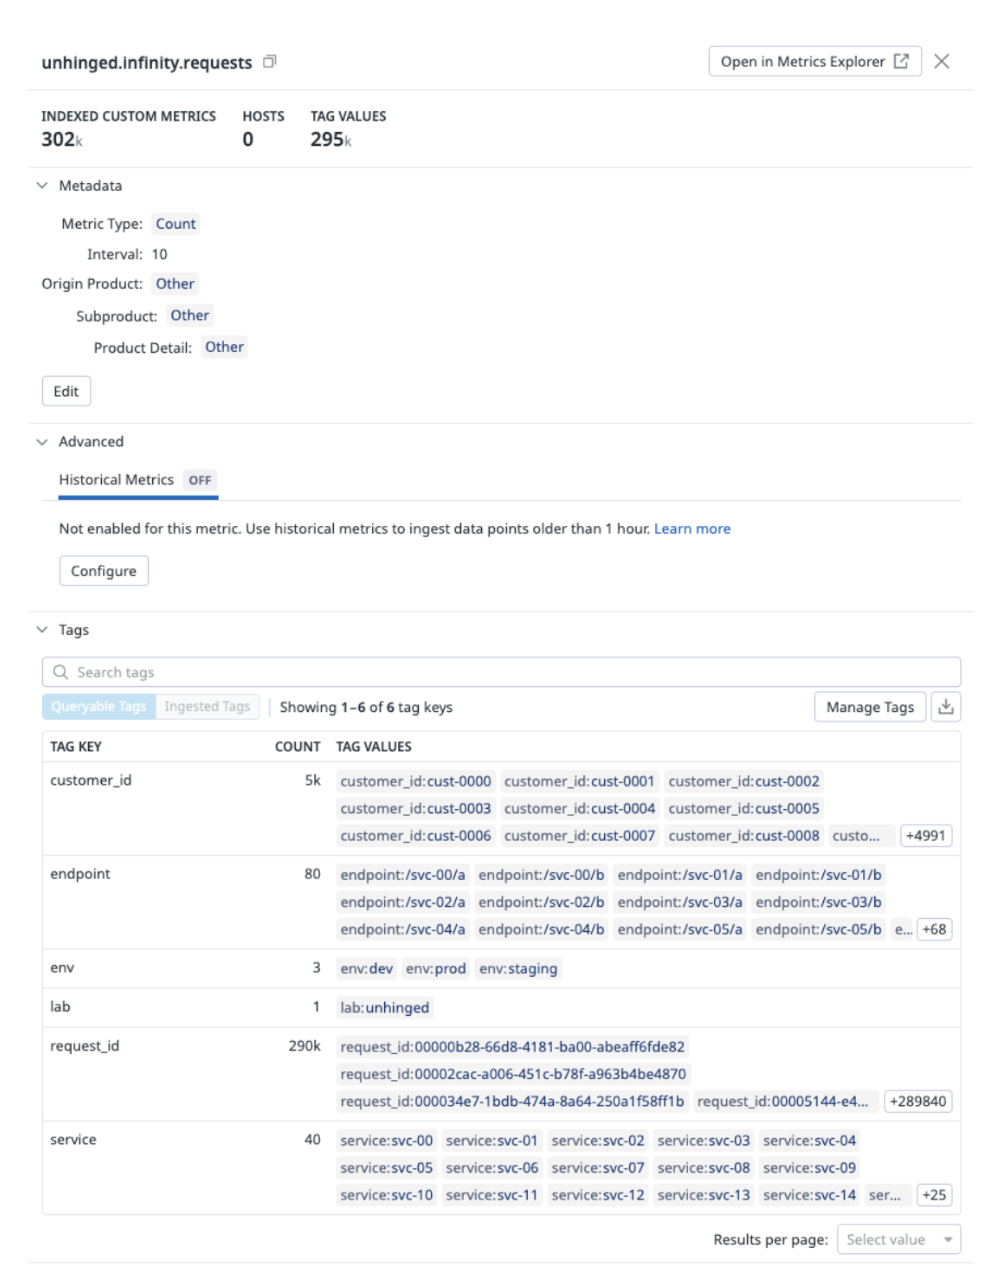
A script on my laptop agreeing with itself isn't proof of anything, though, so I pointed the same fake traffic at a real Datadog account. Two metrics, fed by the exact same requests: unhinged.infinity.requests carries every tag including request_id, and unhinged.infinity.requests.sane carries just env, service and endpoint. I ran it at 100 requests a second for three hours and left it overnight.
| Metric name | First submitted | Est. indexed metrics | Change in volume |
|---|---|---|---|
| unhinged |
16 hours ago | 304k | 304K increase |
| unhinged |
16 hours ago | 239 | 239 increase |
304 thousand against 239. Same requests, same three hours, and the only difference is which tags came along for the ride. The script said 360,000 and 240, so the sane one is off by one and the unhinged one is about 15% low. That column says estimated right in the header, and Datadog's docs say their estimates run 10 to 20 percent off what actually gets billed. (While it was running, the usage metric datadog.estimated_usage.metrics.custom.by_metric read 360,419 for that metric, so the prediction is in there somewhere.) Whichever number you like better, it's still more than a thousand to one.
I do have to be honest about one thing, because I'm the one who brought up infinity. None of this is actually infinite. A random UUID has 122 random bits, so there are about 5.3 × 10^36 possible request IDs, and a Datadog tag tops out at 200 characters, so there's a hard limit on how many distinct tags can exist at all. Those are finite numbers. They are also numbers that the universe will run out of time before you reach, so the difference between "infinite" and "bounded by something absurd" is a thing mathematicians care about and your invoice does not. Datadog's own tagging docs use the word I'd use: tags shouldn't come from unbounded sources like timestamps, user IDs or request IDs.
Infinite Cardinality Metrics: The Hotel Stops Billing by the Room
Now I have to stop, because everything above is one of two ways Datadog bills for this, and the second one is new. In June of 2026 Datadog made a product generally available, and they named it - I swear I'm not making this up - Infinite Cardinality Metrics. That's a hell of a thing to run into while you're writing a post about infinity and cardinality.
The billing side of it is called Metric Name pricing, and Datadog's pitch is one sentence: "A metric is now priced by its metric name, not by the number of unique time series created by tag combinations." You pay for each metric name (any name with more than 100 indexed data points in the month), every name comes with 10 million indexed data points included, and past that you pay for data points. A contract is on this model or the original one, never both.
In hotel terms, the hotel stopped billing by the room. Now there's a flat fee per building, and after the first ten million guests through the door, a fee per head. You can see the catch coming, right? A bus with infinitely many passengers is still infinitely many heads.
Counting Data Points Instead of Series
So I ran the same hour of fake traffic again and counted data points instead of series. There’s one assumption I made rather than something the billing docs spell out: a data point is one value per series per flush. That's how DogStatsD works (we went through flush intervals back in the first post) - every sample with the same metric name and the same tags in the same 10 seconds gets rolled into one point.
| Tags on the metric | Series | Points/hour | Points/month | Over the 10M |
|---|---|---|---|---|
env | 3 | 1,080 | 788,400 | 0 |
+ service | 120 | 32,509 | 23,731,570 | 13,731,570 |
+ endpoint | 240 | 53,387 | 38,972,510 | 28,972,510 |
+ customer_id | 124,710 | 332,236 | 242,532,280 | 232,532,280 |
+ request_id | 360,000 | 360,000 | 262,800,000 | 252,800,000 |
Look at the gap between the sane version (env, service, endpoint) and the unhinged one (request_id). Counted in series, it's 240 against 360,000, which is 1,500 times worse. Counted in points, it's 53,387 against 360,000, which is under 7 times worse. That's a real change, and it's what the name is promising. The unbounded tag isn't the catastrophe it used to be.
It still costs you, though, and the reason is kind of beautiful. When a hundred requests share the same tags in the same ten seconds, they collapse into one data point. That collapse is the only reason the first three rows are small. A unique tag on every request means nothing ever shares, so nothing ever collapses, and every single request becomes its own point. Remember the limit from earlier, that you can't have more tag combinations than data points? It's the same inequality, read from the other side. The old model billed you on the smaller number and the new one bills you on the bigger one.
A few things I'd want you to notice in that table before anybody gets excited. Even the sane version is 39 million points a month, almost four times what's included, because 10 million points only covers about 38 series reporting around the clock at a 10 second flush. Distributions still multiply, by five (or ten with percentiles), except now it's the points being multiplied. And the bill is no longer an hourly average - points add up across the month and don't come back down.
Is it cheaper? I don't know, and a blog post can't know, because the rates and the tiers live in your contract. What I can tell you is that the cardinality didn't go anywhere. It moved to a different set. (And if you've ever put an ID in the metric name, congratulations, you've rebuilt the original problem in the one set that now gets billed per member.)
Okay, so that's the bad news, both flavors of it. Here's where Cantor starts being useful instead of just interesting.
Countable Infinity: Does Every Tag Need a Room?
The infinity in the hotel - 1, 2, 3, forever - is the smallest kind. It's called countable, which doesn't mean you can finish counting it, it means you can put it in a list where every member shows up at some definite position. The whole numbers are obviously like that. The surprising one is fractions. Between any two fractions there's another fraction, and between those two there's another, so it really feels like there have to be more fractions than whole numbers. Cantor showed there aren't. Put every fraction in a grid with numerators across the top and denominators down the side, and then walk the grid in a zigzag along the diagonals: 1/1, 2/1, 1/2, 1/3, 2/2, 3/1, and so on (skipping repeats like 2/2, which is just 1/1 in a hat). Every fraction gets hit eventually, so every fraction has a position in the list, so they pair up with the whole numbers. Same size.
The thing that felt unmanageable turned out to be listable, and that's the exact situation you're in with tags. Every tag value is a string, and strings can be listed. If you can list them, you can go down the list and make a decision about each one, and the decision is the manager's job that nobody at the hotel was doing: does this guest actually need their own room?
For env, service and endpoint, yes. You graph those, you alert on those, you group by them every day. For customer_id it's a real question, and for a handful of your biggest customers the answer might be yes. For request_id the answer is no, and it was always no, because nobody has ever built a dashboard grouped by request ID. What you want is to find one request when something breaks, and that's a search, and searching for one specific thing is what traces and logs are for. Put the ID on the span. It'll be there when you need it, attached to the actual request, instead of sitting in a metric that can't tell you anything about it.
Metrics without Limits: The Manager Finally Shows Up to Work
For the tags you can't get rid of at the source, Datadog has Metrics without Limits, which is the hotel manager finally showing up to work. You pick a metric and give it an allowlist of the tags you want to keep queryable (or a blocklist of the ones you don't), and everything else gets collapsed. The metric still arrives with all its tags, which Datadog calls ingested, but you're only charged the full rate on what's left after the collapse, which is indexed. In my script, allowlisting env, service and endpoint takes that metric from 360,000 series back down to 240. On the original pricing model it isn't free - once you configure a metric, the ingested volume gets billed too, at a much lower rate ($0.10 per 100 over your allotment, per the docs) - but that's a very different conversation than paying full price for 360,000 one-point series. If you've got a pile of metrics with the same problem, Tag Indexing Rules will apply the same list to everything matching a name prefix, including metrics that don't exist yet.
It works on Metric Name pricing too, it just moves a different number. Dropping tags lets the leftover series share data points again, so your indexed points come down. The difference is that on this model every point you send counts as ingested whether you configured the metric or not, and ingest is free up to five times your indexed volume. Strip a busy metric down far enough and you can cross that line, so check the ratio (Datadog gives you datadog.estimated_usage.metrics.points.ratio for exactly this) before you celebrate.
There's an easy part and a hard part here, and I'd be lying if I said they were the same size. Dropping a tag in Metrics without Limits is about four clicks. Getting forty engineering teams to stop adding user_id to things is a people problem, and the tool doesn't solve it. It just makes it cheaper while you work on it.
There's a Bigger Infinity
So that's countable infinity: scary, but listable, and listable means manageable. There's a bigger one, though, and you're already sending it to Datadog.
Cantor's most famous result is that some infinities can't be listed at all. Suppose you claim you've got a complete list of every real number between 0 and 1, every decimal, all of them. I'll build a number that isn't on it. For my first digit I look at the first digit of your first number and pick something different. For my second digit I look at the second digit of your second number and pick something different, and I keep going down the diagonal like that forever. The number I end up with differs from every number on your list in at least one place, so it isn't on your list, and it doesn't matter how you built the list or how long it is. The real numbers are uncountable. There's no zigzag, no clever walk, and no hotel big enough.
Latency is a real number. A request takes 103.8 milliseconds, or 103.81, or 103.8097, depending on how hard you look. So the question "what was my p99 latency" is a question about a pile of values pulled out of a set that can't even be listed.
Now, this is the point where I catch myself, because that's too clean and it's not quite true. Your computer has never stored a real number in its life. It stores a float, there are only 2^64 of those, and the way a float works is that the gaps between the numbers it can represent get wider as the numbers get bigger - you get about 16 significant digits no matter how large or small the value is. Hold onto that, because it's about to come back.
The real problem with latency is more boring and more expensive than uncountability. To get an exact p99 you need every single value, sorted. A million requests means a million numbers, and you can't cheat by having each host work out its own p99 and averaging them, because percentiles don't combine that way. I checked, with a million fake latencies split across a healthy host and one sad, slow one:
real p99 across both hosts:        1,066 ms
average of the two hosts' p99s:    1,691 ms
Not close. So either you ship every raw value to one place and keep them forever, or you find a smarter way to be a little bit wrong.
DDSketch: A Floating-Point Number Told to Calm Down
Datadog's smarter way is called DDSketch, and it's what sits underneath every distribution metric. The idea is that you pick how wrong you're willing to be as a percentage (Datadog's own writeup uses 2%), and then you chop the number line into buckets where each bucket's upper edge is a fixed multiple of its lower edge. At 2% that multiple is 1.02 / 0.98, about 1.04. So one bucket covers roughly 0.98ms to 1.02ms, and way up the line another one covers roughly 980ms to 1,020ms. The buckets get wider as the numbers get bigger, but they're always the same width relative to what's in them. Then you throw away the values and just keep a counter per bucket.
Sound familiar? It's the same trick as the float. Constant relative precision, with gaps that grow as the numbers do. A DDSketch is basically a floating point number that's been told to calm down and only keep two significant digits.
It's about ten lines of Python if you strip it to the bone:
ALPHA = 0.02                         # the relative error we are willing to eat
GAMMA = (1 + ALPHA) / (1 - ALPHA)  # each bucket's top edge is GAMMA x its bottom

def bucket(value):
    return math.ceil(math.log(value, GAMMA))

def representative(i):
    return 2 * GAMMA**i / (GAMMA + 1)

def sketch(values):
    return Counter(bucket(v) for v in values)
And here's what it does to those million latencies:
| quantile | exact (ms) | sketch (ms) | relative error |
|---|---|---|---|
| p50 | 54.537 | 53.535 | 1.838% |
| p75 | 107.059 | 105.681 | 1.287% |
| p90 | 196.830 | 200.438 | 1.833% |
| p95 | 283.020 | 287.308 | 1.515% |
| p99 | 560.364 | 567.162 | 1.213% |
| p99.9 | 1212.804 | 1212.873 | 0.006% |
Hell yeah. A million values went in, 224 counters came out, and every percentile I asked for landed inside the 2% it promised. That's not dumb luck, but a guarantee, and it holds for any percentile on any data, because every value that lands in a bucket is within 2% of the one number that bucket hands back.
Merging Sketches Across Hosts
That last line is the part that fixes the averaging problem. Two hosts can each build their own sketch, and because they're both using the same bucket edges, merging them is just adding the counters together. You get the identical sketch you'd have built if all the data had been in one place to begin with, and that's why a distribution metric can give you a real p99 across your whole fleet when a histogram (which does its math on each Agent) can't.
It also barely grows. Because the buckets are spaced on a log scale, covering everything from 1 millisecond to 1 minute at 2% takes 275 buckets, which is about 2kB. Covering everything from 1 nanosecond to an entire day takes 802. That's fourteen orders of magnitude for about three times the buckets.
So the answer to an infinity you can't list is that you stop trying to list it. You decide up front how much error you can live with, you build rooms that are that wide, and you count heads. Your p99 is approximate, but it's approximate in a way you chose and can prove, and I'll take that over an exact answer to the wrong question every time.
(Cantor's ladder doesn't stop at the real numbers, by the way. There's a bigger infinity above that one, and a bigger one above that, forever. I'm leaving it alone because Datadog hasn't found a way to bill for it yet.)
Three Steps to Investigate High-Cardinality Metrics
So what do you do with all of this? Three things, and you can do them this week.
First, find your biggest hotels. The Metrics Volume Management page lists your top 500 metric names by cardinality, and a second list of the ones that are spiking. If you'd rather graph it, datadog.estimated_usage.metrics.custom.by_metric gives you the same thing as a metric (use sum by, and expect it to be an estimate). If you're on Metric Name pricing, that metric stops reporting and the one you want is datadog.estimated_usage.billable.points, broken down by metric name. Step zero, really, is finding out which model your contract is on.
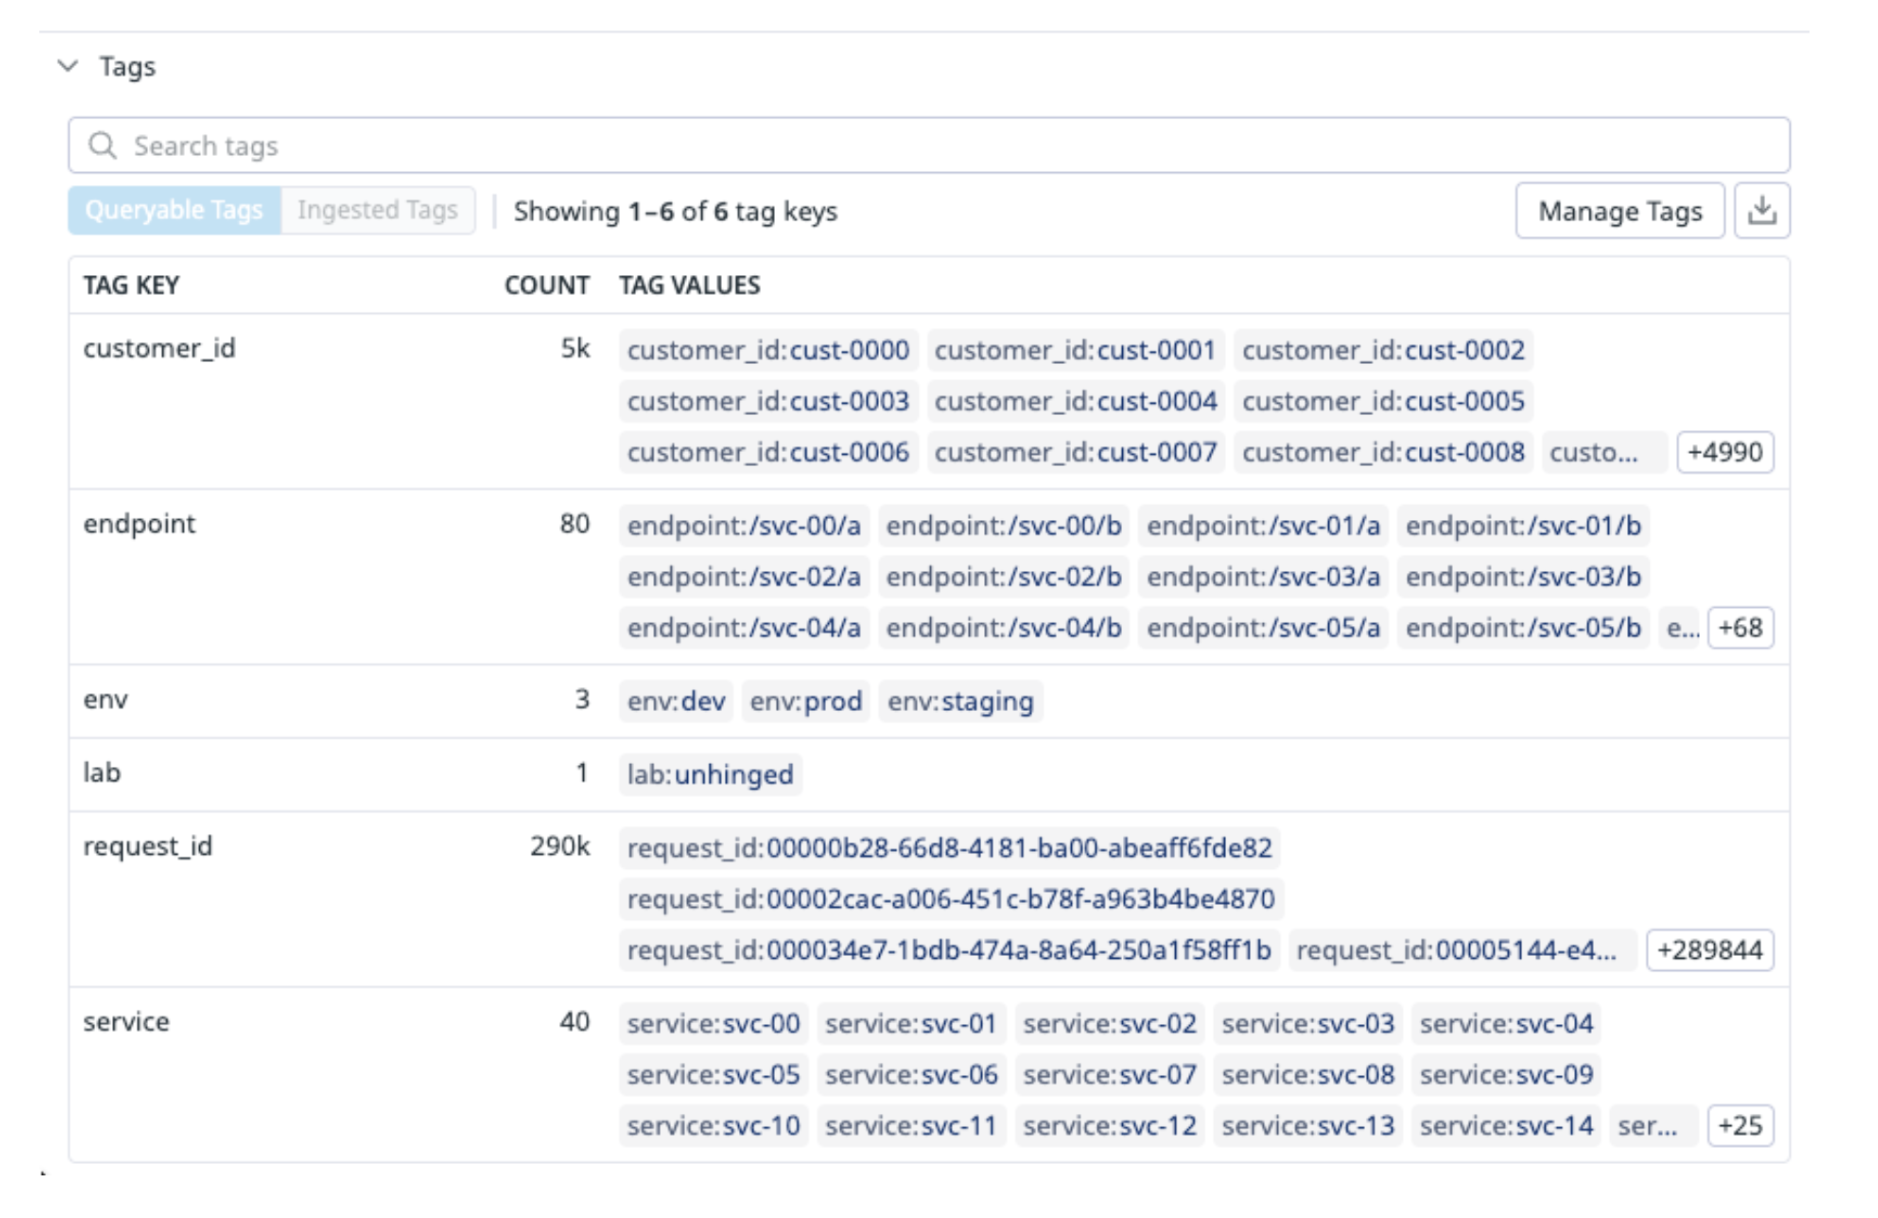
Second, for the top handful, open the Custom Metrics Tags Cardinality Explorer and find out which tag is the bus. It's almost always one tag, and it's almost always an ID.
Third, go down the list and make the manager's call on each one. Does anybody group by this? If yes, it stays. If the only thing anybody ever does with it is look up a single value, it belongs on a span or a log, and it needs to come off the metric - at the source if you can get the team to do it, with Metrics without Limits if you can't.
That list is, for what it's worth, pretty much what a NoBServatory report hands you. You don't need us for it, though. You need an afternoon and a willingness to ask "who actually uses this tag" out loud in a room full of people who added it.
Cardinality is the number of unique tag value combinations on a metric. Same sentence I started with, and I believe it now. All it took was a hotel with no last room, two different sizes of infinity, and a floating point number with the precision turned down.